Crow vs Welsh Professional Degree
COMPARE
Crow
Welsh
Professional Degree
Professional Degree Comparison
Crow
Welsh
3.2%
PROFESSIONAL DEGREE
0.0/ 100
METRIC RATING
324th/ 347
METRIC RANK
4.3%
PROFESSIONAL DEGREE
35.8/ 100
METRIC RATING
185th/ 347
METRIC RANK
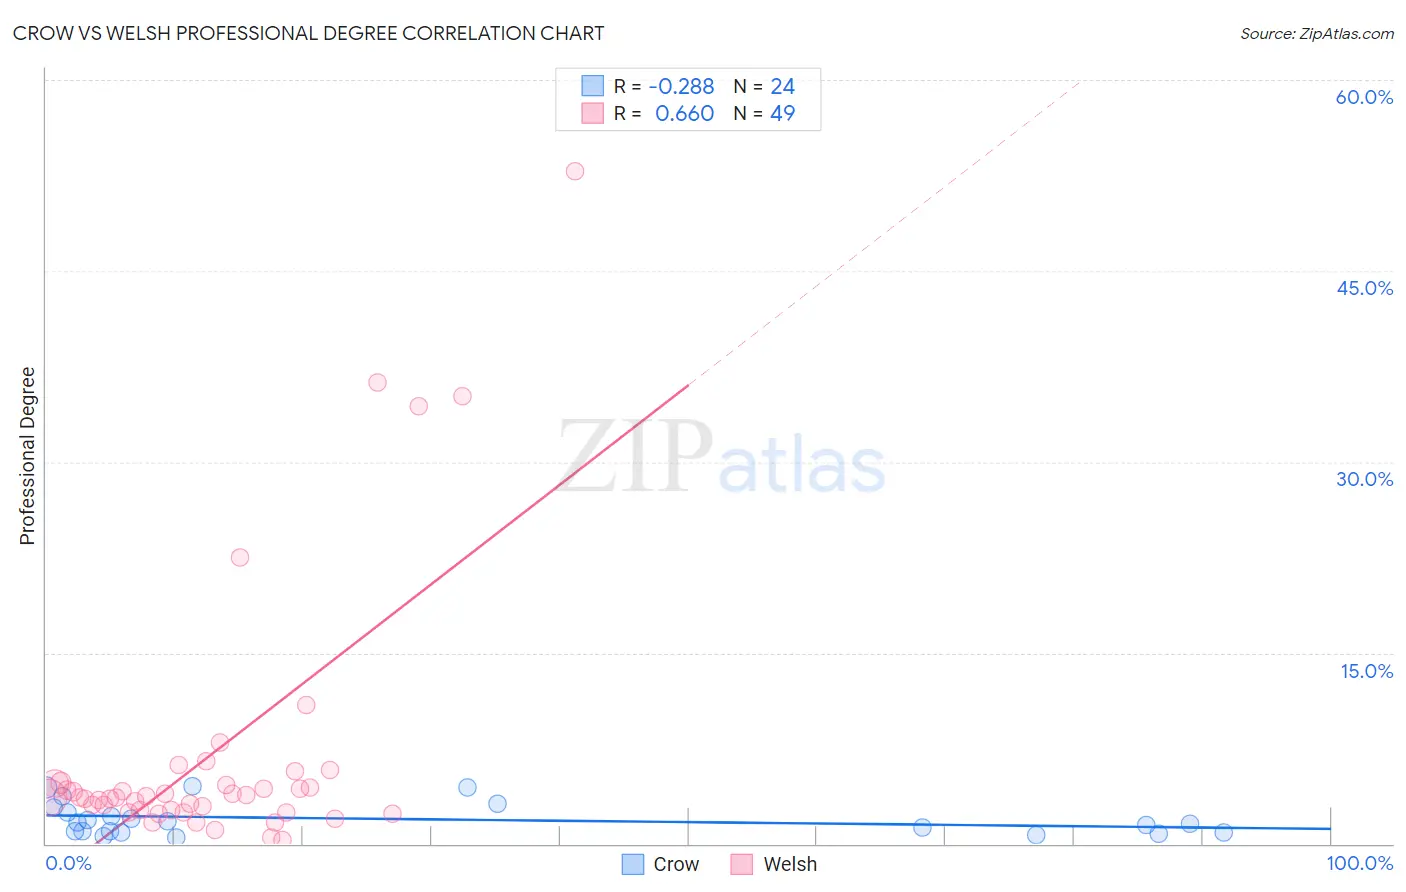
Crow vs Welsh Professional Degree Correlation Chart
The statistical analysis conducted on geographies consisting of 59,107,625 people shows a weak negative correlation between the proportion of Crow and percentage of population with at least professional degree education in the United States with a correlation coefficient (R) of -0.288 and weighted average of 3.2%. Similarly, the statistical analysis conducted on geographies consisting of 523,806,417 people shows a significant positive correlation between the proportion of Welsh and percentage of population with at least professional degree education in the United States with a correlation coefficient (R) of 0.660 and weighted average of 4.3%, a difference of 36.6%.
Professional Degree Correlation Summary
| Measurement | Crow | Welsh |
| Minimum | 0.53% | 0.26% |
| Maximum | 4.5% | 52.8% |
| Range | 4.0% | 52.6% |
| Mean | 2.0% | 7.0% |
| Median | 1.6% | 3.6% |
| Interquartile 25% (IQ1) | 0.93% | 2.5% |
| Interquartile 75% (IQ3) | 2.7% | 4.8% |
| Interquartile Range (IQR) | 1.7% | 2.2% |
| Standard Deviation (Sample) | 1.3% | 10.6% |
| Standard Deviation (Population) | 1.3% | 10.5% |
Similar Demographics by Professional Degree
Demographics Similar to Crow by Professional Degree
In terms of professional degree, the demographic groups most similar to Crow are Yaqui (3.2%, a difference of 0.060%), Inupiat (3.2%, a difference of 0.27%), Hispanic or Latino (3.2%, a difference of 0.35%), Tsimshian (3.2%, a difference of 0.72%), and Seminole (3.2%, a difference of 1.1%).
| Demographics | Rating | Rank | Professional Degree |
| Nepalese | 0.1 /100 | #317 | Tragic 3.2% |
| Immigrants | Micronesia | 0.1 /100 | #318 | Tragic 3.2% |
| Choctaw | 0.1 /100 | #319 | Tragic 3.2% |
| Seminole | 0.1 /100 | #320 | Tragic 3.2% |
| Tsimshian | 0.0 /100 | #321 | Tragic 3.2% |
| Hispanics or Latinos | 0.0 /100 | #322 | Tragic 3.2% |
| Inupiat | 0.0 /100 | #323 | Tragic 3.2% |
| Crow | 0.0 /100 | #324 | Tragic 3.2% |
| Yaqui | 0.0 /100 | #325 | Tragic 3.2% |
| Menominee | 0.0 /100 | #326 | Tragic 3.1% |
| Dutch West Indians | 0.0 /100 | #327 | Tragic 3.1% |
| Creek | 0.0 /100 | #328 | Tragic 3.1% |
| Bangladeshis | 0.0 /100 | #329 | Tragic 3.1% |
| Immigrants | Cabo Verde | 0.0 /100 | #330 | Tragic 3.1% |
| Kiowa | 0.0 /100 | #331 | Tragic 3.1% |
Demographics Similar to Welsh by Professional Degree
In terms of professional degree, the demographic groups most similar to Welsh are Belgian (4.3%, a difference of 0.060%), Scotch-Irish (4.3%, a difference of 0.27%), Immigrants from Cameroon (4.3%, a difference of 0.42%), Immigrants from Thailand (4.3%, a difference of 0.69%), and Slovak (4.3%, a difference of 0.87%).
| Demographics | Rating | Rank | Professional Degree |
| Immigrants | Costa Rica | 46.7 /100 | #178 | Average 4.4% |
| Immigrants | Kenya | 45.9 /100 | #179 | Average 4.4% |
| Czechs | 44.9 /100 | #180 | Average 4.4% |
| Danes | 43.5 /100 | #181 | Average 4.4% |
| Immigrants | Immigrants | 43.2 /100 | #182 | Average 4.4% |
| Bermudans | 43.1 /100 | #183 | Average 4.4% |
| Belgians | 36.2 /100 | #184 | Fair 4.3% |
| Welsh | 35.8 /100 | #185 | Fair 4.3% |
| Scotch-Irish | 34.2 /100 | #186 | Fair 4.3% |
| Immigrants | Cameroon | 33.3 /100 | #187 | Fair 4.3% |
| Immigrants | Thailand | 31.7 /100 | #188 | Fair 4.3% |
| Slovaks | 30.7 /100 | #189 | Fair 4.3% |
| Immigrants | Poland | 29.2 /100 | #190 | Fair 4.3% |
| Sri Lankans | 29.0 /100 | #191 | Fair 4.3% |
| Ghanaians | 27.3 /100 | #192 | Fair 4.3% |