Crow vs Immigrants from Bulgaria Poverty
COMPARE
Crow
Immigrants from Bulgaria
Poverty
Poverty Comparison
Crow
Immigrants from Bulgaria
20.7%
POVERTY
0.0/ 100
METRIC RATING
339th/ 347
METRIC RANK
11.1%
POVERTY
98.5/ 100
METRIC RATING
54th/ 347
METRIC RANK
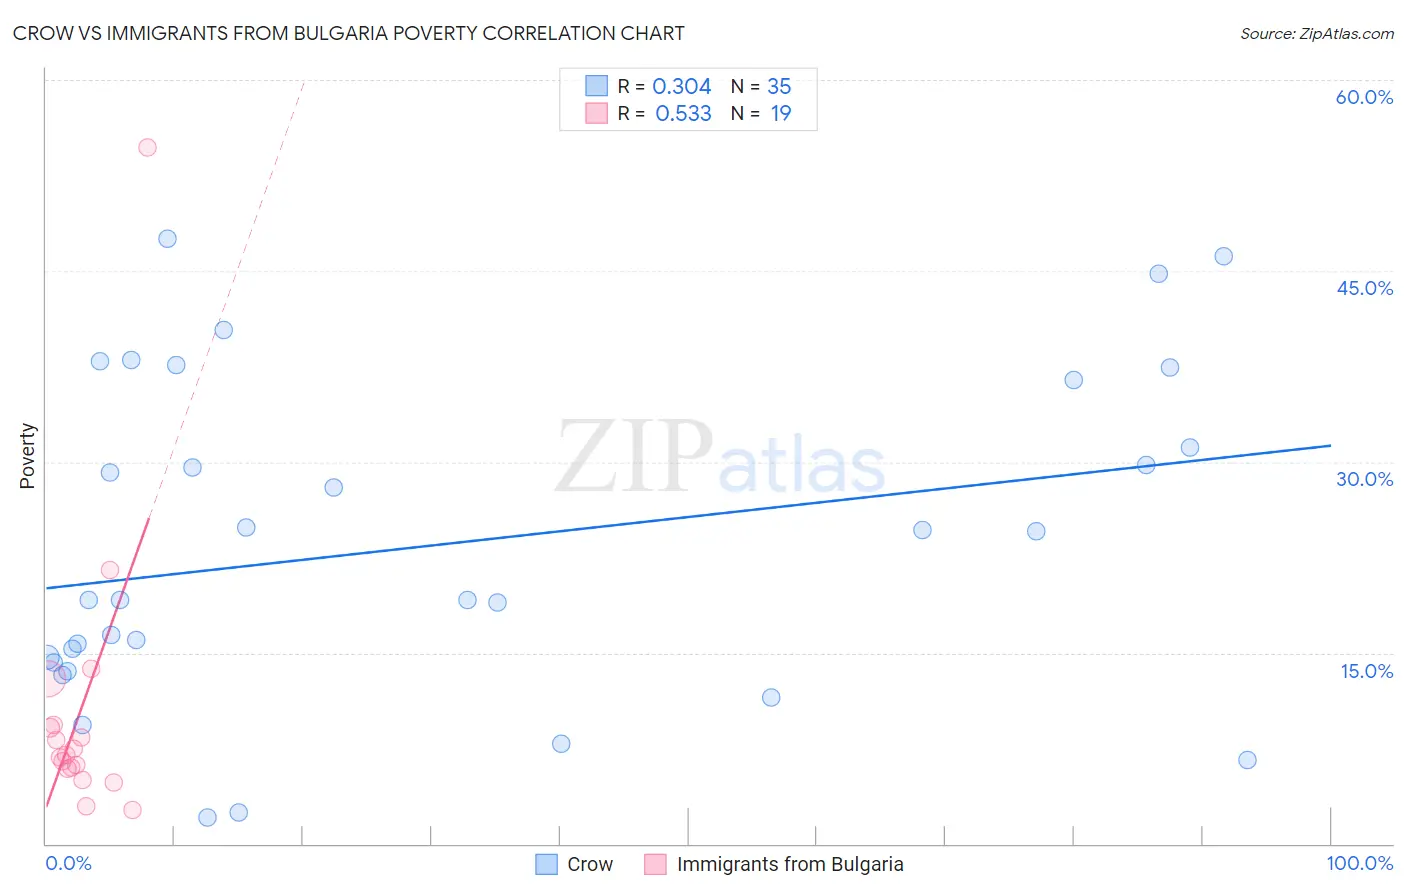
Crow vs Immigrants from Bulgaria Poverty Correlation Chart
The statistical analysis conducted on geographies consisting of 59,200,262 people shows a mild positive correlation between the proportion of Crow and poverty level in the United States with a correlation coefficient (R) of 0.304 and weighted average of 20.7%. Similarly, the statistical analysis conducted on geographies consisting of 172,536,486 people shows a substantial positive correlation between the proportion of Immigrants from Bulgaria and poverty level in the United States with a correlation coefficient (R) of 0.533 and weighted average of 11.1%, a difference of 86.7%.
Poverty Correlation Summary
| Measurement | Crow | Immigrants from Bulgaria |
| Minimum | 2.1% | 2.7% |
| Maximum | 47.5% | 54.7% |
| Range | 45.4% | 52.0% |
| Mean | 23.5% | 10.5% |
| Median | 19.2% | 7.0% |
| Interquartile 25% (IQ1) | 14.3% | 5.8% |
| Interquartile 75% (IQ3) | 36.4% | 9.4% |
| Interquartile Range (IQR) | 22.1% | 3.5% |
| Standard Deviation (Sample) | 12.7% | 11.5% |
| Standard Deviation (Population) | 12.5% | 11.2% |
Similar Demographics by Poverty
Demographics Similar to Crow by Poverty
In terms of poverty, the demographic groups most similar to Crow are Yup'ik (20.8%, a difference of 0.75%), Hopi (20.8%, a difference of 0.93%), Yuman (20.2%, a difference of 2.2%), Immigrants from Yemen (21.5%, a difference of 4.1%), and Sioux (19.8%, a difference of 4.5%).
| Demographics | Rating | Rank | Poverty |
| Natives/Alaskans | 0.0 /100 | #332 | Tragic 18.1% |
| Houma | 0.0 /100 | #333 | Tragic 18.4% |
| Apache | 0.0 /100 | #334 | Tragic 18.4% |
| Cheyenne | 0.0 /100 | #335 | Tragic 18.9% |
| Pueblo | 0.0 /100 | #336 | Tragic 19.4% |
| Sioux | 0.0 /100 | #337 | Tragic 19.8% |
| Yuman | 0.0 /100 | #338 | Tragic 20.2% |
| Crow | 0.0 /100 | #339 | Tragic 20.7% |
| Yup'ik | 0.0 /100 | #340 | Tragic 20.8% |
| Hopi | 0.0 /100 | #341 | Tragic 20.8% |
| Immigrants | Yemen | 0.0 /100 | #342 | Tragic 21.5% |
| Pima | 0.0 /100 | #343 | Tragic 21.9% |
| Lumbee | 0.0 /100 | #344 | Tragic 21.9% |
| Navajo | 0.0 /100 | #345 | Tragic 23.1% |
| Puerto Ricans | 0.0 /100 | #346 | Tragic 23.7% |
Demographics Similar to Immigrants from Bulgaria by Poverty
In terms of poverty, the demographic groups most similar to Immigrants from Bulgaria are Immigrants from Serbia (11.1%, a difference of 0.030%), Immigrants from Austria (11.1%, a difference of 0.12%), Immigrants from Philippines (11.0%, a difference of 0.34%), Immigrants from Croatia (11.0%, a difference of 0.36%), and Estonian (11.1%, a difference of 0.51%).
| Demographics | Rating | Rank | Poverty |
| Immigrants | Romania | 98.9 /100 | #47 | Exceptional 11.0% |
| Slovenes | 98.9 /100 | #48 | Exceptional 11.0% |
| Immigrants | Japan | 98.9 /100 | #49 | Exceptional 11.0% |
| Asians | 98.9 /100 | #50 | Exceptional 11.0% |
| Immigrants | Croatia | 98.7 /100 | #51 | Exceptional 11.0% |
| Immigrants | Philippines | 98.7 /100 | #52 | Exceptional 11.0% |
| Immigrants | Austria | 98.6 /100 | #53 | Exceptional 11.1% |
| Immigrants | Bulgaria | 98.5 /100 | #54 | Exceptional 11.1% |
| Immigrants | Serbia | 98.5 /100 | #55 | Exceptional 11.1% |
| Estonians | 98.2 /100 | #56 | Exceptional 11.1% |
| Scandinavians | 98.2 /100 | #57 | Exceptional 11.1% |
| Germans | 98.1 /100 | #58 | Exceptional 11.1% |
| Immigrants | Europe | 98.0 /100 | #59 | Exceptional 11.2% |
| Immigrants | Sri Lanka | 97.9 /100 | #60 | Exceptional 11.2% |
| Immigrants | Italy | 97.9 /100 | #61 | Exceptional 11.2% |