Lithuanian vs Immigrants from Serbia Single Father Poverty
COMPARE
Lithuanian
Immigrants from Serbia
Single Father Poverty
Single Father Poverty Comparison
Lithuanians
Immigrants from Serbia
17.3%
SINGLE FATHER POVERTY
0.4/ 100
METRIC RATING
263rd/ 347
METRIC RANK
15.5%
SINGLE FATHER POVERTY
98.5/ 100
METRIC RATING
92nd/ 347
METRIC RANK
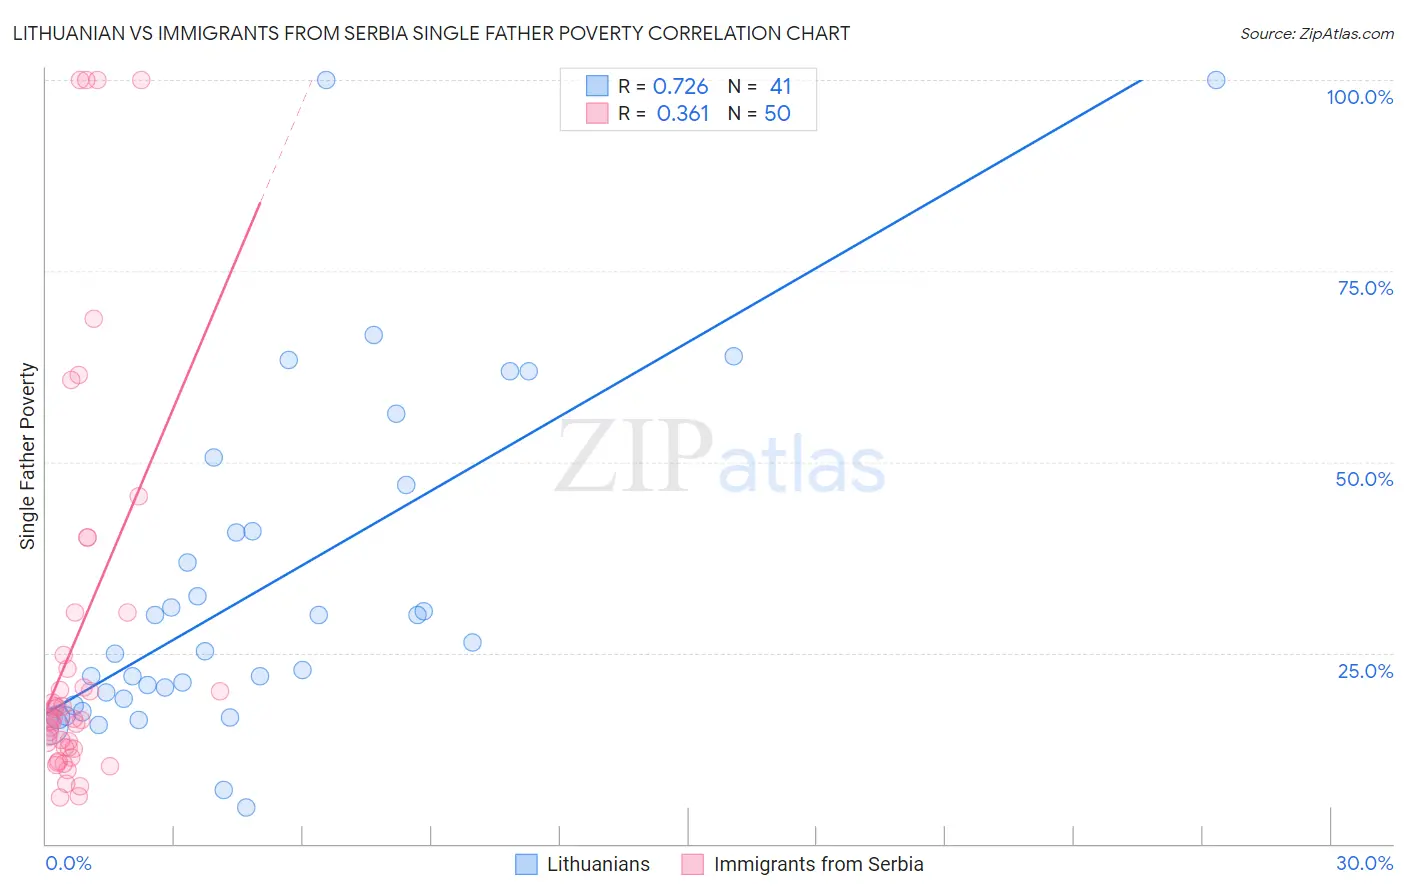
Lithuanian vs Immigrants from Serbia Single Father Poverty Correlation Chart
The statistical analysis conducted on geographies consisting of 319,660,804 people shows a strong positive correlation between the proportion of Lithuanians and poverty level among single fathers in the United States with a correlation coefficient (R) of 0.726 and weighted average of 17.3%. Similarly, the statistical analysis conducted on geographies consisting of 114,512,326 people shows a mild positive correlation between the proportion of Immigrants from Serbia and poverty level among single fathers in the United States with a correlation coefficient (R) of 0.361 and weighted average of 15.5%, a difference of 11.2%.
Single Father Poverty Correlation Summary
| Measurement | Lithuanian | Immigrants from Serbia |
| Minimum | 4.8% | 6.1% |
| Maximum | 100.0% | 100.0% |
| Range | 95.2% | 93.9% |
| Mean | 33.8% | 26.6% |
| Median | 25.2% | 16.4% |
| Interquartile 25% (IQ1) | 18.5% | 12.5% |
| Interquartile 75% (IQ3) | 44.0% | 24.8% |
| Interquartile Range (IQR) | 25.5% | 12.2% |
| Standard Deviation (Sample) | 22.3% | 25.8% |
| Standard Deviation (Population) | 22.1% | 25.6% |
Similar Demographics by Single Father Poverty
Demographics Similar to Lithuanians by Single Father Poverty
In terms of single father poverty, the demographic groups most similar to Lithuanians are Immigrants from Zaire (17.3%, a difference of 0.010%), Swiss (17.3%, a difference of 0.14%), Slovene (17.3%, a difference of 0.20%), Polish (17.3%, a difference of 0.21%), and Jamaican (17.3%, a difference of 0.26%).
| Demographics | Rating | Rank | Single Father Poverty |
| Immigrants | Haiti | 0.8 /100 | #256 | Tragic 17.2% |
| Immigrants | Albania | 0.7 /100 | #257 | Tragic 17.2% |
| Albanians | 0.7 /100 | #258 | Tragic 17.2% |
| Immigrants | Jamaica | 0.7 /100 | #259 | Tragic 17.2% |
| Spaniards | 0.6 /100 | #260 | Tragic 17.2% |
| Swiss | 0.5 /100 | #261 | Tragic 17.3% |
| Immigrants | Zaire | 0.4 /100 | #262 | Tragic 17.3% |
| Lithuanians | 0.4 /100 | #263 | Tragic 17.3% |
| Slovenes | 0.3 /100 | #264 | Tragic 17.3% |
| Poles | 0.3 /100 | #265 | Tragic 17.3% |
| Jamaicans | 0.3 /100 | #266 | Tragic 17.3% |
| Haitians | 0.3 /100 | #267 | Tragic 17.3% |
| Immigrants | Caribbean | 0.3 /100 | #268 | Tragic 17.4% |
| Slavs | 0.3 /100 | #269 | Tragic 17.4% |
| Indonesians | 0.2 /100 | #270 | Tragic 17.4% |
Demographics Similar to Immigrants from Serbia by Single Father Poverty
In terms of single father poverty, the demographic groups most similar to Immigrants from Serbia are Basque (15.5%, a difference of 0.040%), Immigrants from Romania (15.5%, a difference of 0.11%), Immigrants from Uruguay (15.6%, a difference of 0.17%), Mexican American Indian (15.5%, a difference of 0.21%), and Immigrants from Kazakhstan (15.6%, a difference of 0.23%).
| Demographics | Rating | Rank | Single Father Poverty |
| Immigrants | Oceania | 99.1 /100 | #85 | Exceptional 15.4% |
| Immigrants | Russia | 99.0 /100 | #86 | Exceptional 15.5% |
| Brazilians | 99.0 /100 | #87 | Exceptional 15.5% |
| Burmese | 99.0 /100 | #88 | Exceptional 15.5% |
| Immigrants | Korea | 99.0 /100 | #89 | Exceptional 15.5% |
| Mexican American Indians | 98.7 /100 | #90 | Exceptional 15.5% |
| Immigrants | Romania | 98.6 /100 | #91 | Exceptional 15.5% |
| Immigrants | Serbia | 98.5 /100 | #92 | Exceptional 15.5% |
| Basques | 98.4 /100 | #93 | Exceptional 15.5% |
| Immigrants | Uruguay | 98.2 /100 | #94 | Exceptional 15.6% |
| Immigrants | Kazakhstan | 98.2 /100 | #95 | Exceptional 15.6% |
| Immigrants | Belgium | 98.1 /100 | #96 | Exceptional 15.6% |
| Yaqui | 98.1 /100 | #97 | Exceptional 15.6% |
| Zimbabweans | 98.1 /100 | #98 | Exceptional 15.6% |
| Immigrants | Middle Africa | 97.4 /100 | #99 | Exceptional 15.6% |