Immigrants from Northern Africa vs Immigrants from Serbia Single Father Poverty
COMPARE
Immigrants from Northern Africa
Immigrants from Serbia
Single Father Poverty
Single Father Poverty Comparison
Immigrants from Northern Africa
Immigrants from Serbia
15.3%
SINGLE FATHER POVERTY
99.5/ 100
METRIC RATING
79th/ 347
METRIC RANK
15.5%
SINGLE FATHER POVERTY
98.5/ 100
METRIC RATING
92nd/ 347
METRIC RANK
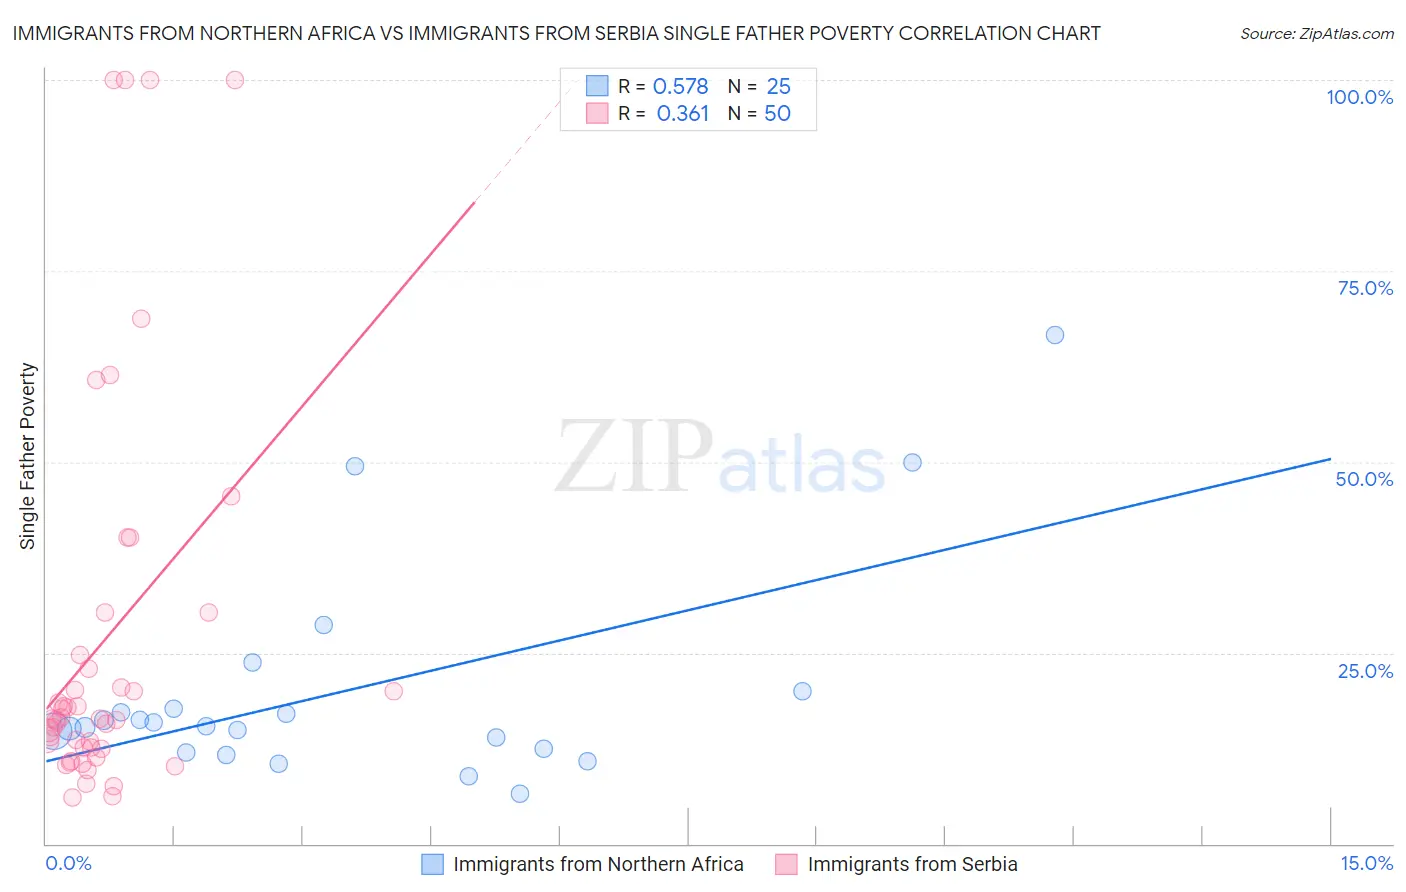
Immigrants from Northern Africa vs Immigrants from Serbia Single Father Poverty Correlation Chart
The statistical analysis conducted on geographies consisting of 259,386,698 people shows a substantial positive correlation between the proportion of Immigrants from Northern Africa and poverty level among single fathers in the United States with a correlation coefficient (R) of 0.578 and weighted average of 15.3%. Similarly, the statistical analysis conducted on geographies consisting of 114,512,326 people shows a mild positive correlation between the proportion of Immigrants from Serbia and poverty level among single fathers in the United States with a correlation coefficient (R) of 0.361 and weighted average of 15.5%, a difference of 1.3%.
Single Father Poverty Correlation Summary
| Measurement | Immigrants from Northern Africa | Immigrants from Serbia |
| Minimum | 6.6% | 6.1% |
| Maximum | 66.7% | 100.0% |
| Range | 60.1% | 93.9% |
| Mean | 20.0% | 26.6% |
| Median | 15.3% | 16.4% |
| Interquartile 25% (IQ1) | 12.2% | 12.5% |
| Interquartile 75% (IQ3) | 18.8% | 24.8% |
| Interquartile Range (IQR) | 6.7% | 12.2% |
| Standard Deviation (Sample) | 14.3% | 25.8% |
| Standard Deviation (Population) | 14.0% | 25.6% |
Demographics Similar to Immigrants from Northern Africa and Immigrants from Serbia by Single Father Poverty
In terms of single father poverty, the demographic groups most similar to Immigrants from Northern Africa are Tlingit-Haida (15.3%, a difference of 0.020%), Immigrants from Peru (15.3%, a difference of 0.060%), Immigrants from Japan (15.3%, a difference of 0.080%), Immigrants from Turkey (15.3%, a difference of 0.16%), and Armenian (15.4%, a difference of 0.23%). Similarly, the demographic groups most similar to Immigrants from Serbia are Basque (15.5%, a difference of 0.040%), Immigrants from Romania (15.5%, a difference of 0.11%), Immigrants from Uruguay (15.6%, a difference of 0.17%), Mexican American Indian (15.5%, a difference of 0.21%), and Immigrants from Kazakhstan (15.6%, a difference of 0.23%).
| Demographics | Rating | Rank | Single Father Poverty |
| Immigrants | Turkey | 99.5 /100 | #75 | Exceptional 15.3% |
| Immigrants | Japan | 99.5 /100 | #76 | Exceptional 15.3% |
| Immigrants | Peru | 99.5 /100 | #77 | Exceptional 15.3% |
| Tlingit-Haida | 99.5 /100 | #78 | Exceptional 15.3% |
| Immigrants | Northern Africa | 99.5 /100 | #79 | Exceptional 15.3% |
| Armenians | 99.4 /100 | #80 | Exceptional 15.4% |
| Immigrants | Congo | 99.4 /100 | #81 | Exceptional 15.4% |
| Immigrants | Ukraine | 99.4 /100 | #82 | Exceptional 15.4% |
| Chinese | 99.3 /100 | #83 | Exceptional 15.4% |
| Peruvians | 99.2 /100 | #84 | Exceptional 15.4% |
| Immigrants | Oceania | 99.1 /100 | #85 | Exceptional 15.4% |
| Immigrants | Russia | 99.0 /100 | #86 | Exceptional 15.5% |
| Brazilians | 99.0 /100 | #87 | Exceptional 15.5% |
| Burmese | 99.0 /100 | #88 | Exceptional 15.5% |
| Immigrants | Korea | 99.0 /100 | #89 | Exceptional 15.5% |
| Mexican American Indians | 98.7 /100 | #90 | Exceptional 15.5% |
| Immigrants | Romania | 98.6 /100 | #91 | Exceptional 15.5% |
| Immigrants | Serbia | 98.5 /100 | #92 | Exceptional 15.5% |
| Basques | 98.4 /100 | #93 | Exceptional 15.5% |
| Immigrants | Uruguay | 98.2 /100 | #94 | Exceptional 15.6% |
| Immigrants | Kazakhstan | 98.2 /100 | #95 | Exceptional 15.6% |