Crow vs Macedonian Single Father Poverty
COMPARE
Crow
Macedonian
Single Father Poverty
Single Father Poverty Comparison
Crow
Macedonians
30.3%
SINGLE FATHER POVERTY
0.0/ 100
METRIC RATING
345th/ 347
METRIC RANK
17.7%
SINGLE FATHER POVERTY
0.1/ 100
METRIC RATING
274th/ 347
METRIC RANK
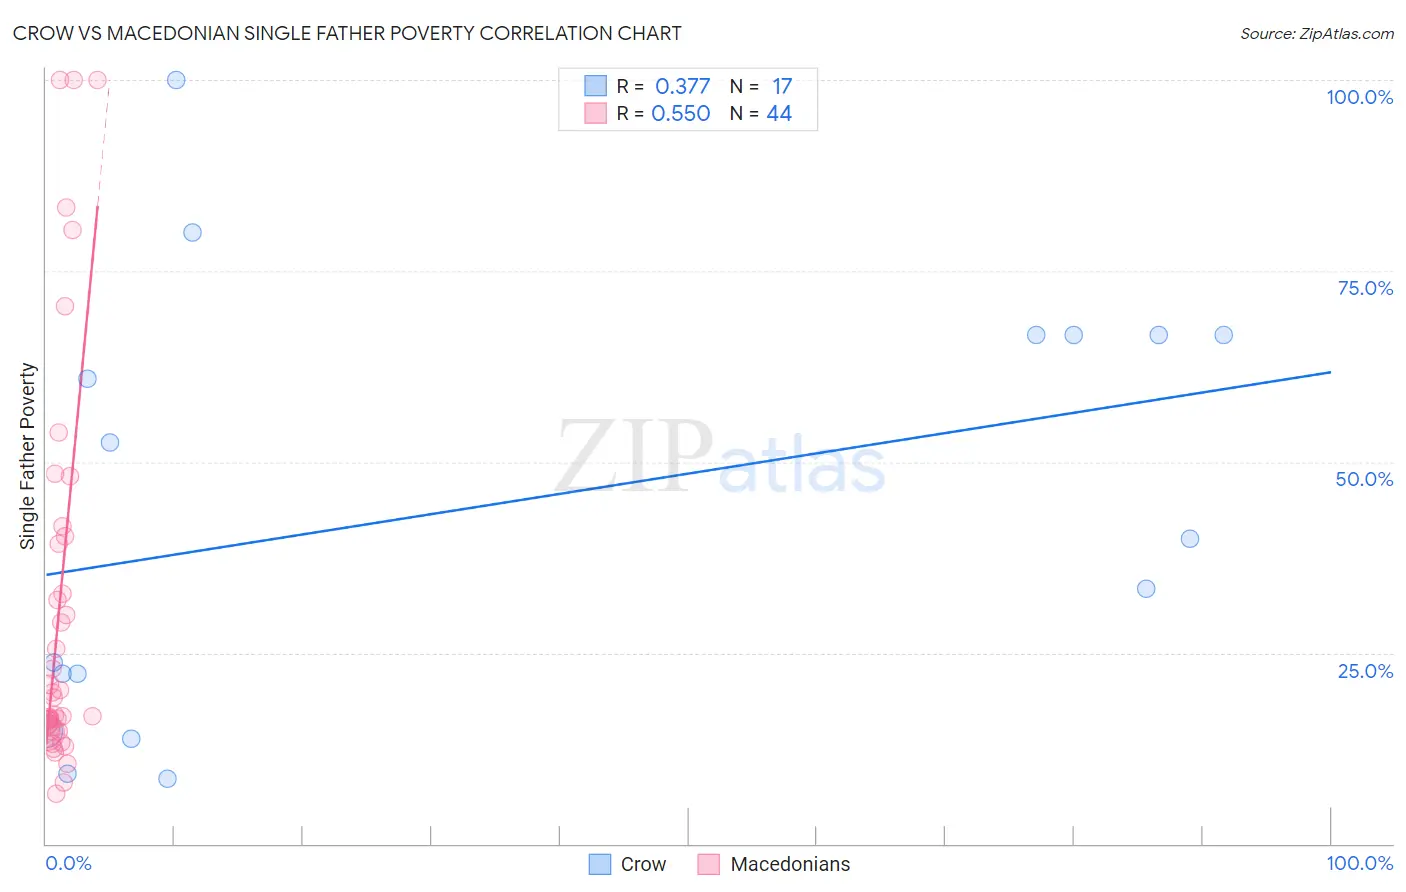
Crow vs Macedonian Single Father Poverty Correlation Chart
The statistical analysis conducted on geographies consisting of 55,517,191 people shows a mild positive correlation between the proportion of Crow and poverty level among single fathers in the United States with a correlation coefficient (R) of 0.377 and weighted average of 30.3%. Similarly, the statistical analysis conducted on geographies consisting of 112,665,008 people shows a substantial positive correlation between the proportion of Macedonians and poverty level among single fathers in the United States with a correlation coefficient (R) of 0.550 and weighted average of 17.7%, a difference of 71.5%.
Single Father Poverty Correlation Summary
| Measurement | Crow | Macedonian |
| Minimum | 8.6% | 6.6% |
| Maximum | 100.0% | 100.0% |
| Range | 91.4% | 93.4% |
| Mean | 44.0% | 31.1% |
| Median | 40.0% | 18.0% |
| Interquartile 25% (IQ1) | 18.4% | 15.0% |
| Interquartile 75% (IQ3) | 66.7% | 39.8% |
| Interquartile Range (IQR) | 48.2% | 24.8% |
| Standard Deviation (Sample) | 28.0% | 26.1% |
| Standard Deviation (Population) | 27.2% | 25.8% |
Similar Demographics by Single Father Poverty
Demographics Similar to Crow by Single Father Poverty
In terms of single father poverty, the demographic groups most similar to Crow are Navajo (29.2%, a difference of 3.6%), Puerto Rican (31.5%, a difference of 4.1%), Lumbee (28.5%, a difference of 6.3%), Yuman (28.4%, a difference of 6.7%), and Yup'ik (32.5%, a difference of 7.4%).
| Demographics | Rating | Rank | Single Father Poverty |
| Natives/Alaskans | 0.0 /100 | #333 | Tragic 22.4% |
| Kiowa | 0.0 /100 | #334 | Tragic 22.5% |
| Shoshone | 0.0 /100 | #335 | Tragic 22.9% |
| Cajuns | 0.0 /100 | #336 | Tragic 23.1% |
| Sioux | 0.0 /100 | #337 | Tragic 23.9% |
| Arapaho | 0.0 /100 | #338 | Tragic 24.0% |
| Apache | 0.0 /100 | #339 | Tragic 24.2% |
| Houma | 0.0 /100 | #340 | Tragic 26.7% |
| Hopi | 0.0 /100 | #341 | Tragic 27.2% |
| Yuman | 0.0 /100 | #342 | Tragic 28.4% |
| Lumbee | 0.0 /100 | #343 | Tragic 28.5% |
| Navajo | 0.0 /100 | #344 | Tragic 29.2% |
| Crow | 0.0 /100 | #345 | Tragic 30.3% |
| Puerto Ricans | 0.0 /100 | #346 | Tragic 31.5% |
| Yup'ik | 0.0 /100 | #347 | Tragic 32.5% |
Demographics Similar to Macedonians by Single Father Poverty
In terms of single father poverty, the demographic groups most similar to Macedonians are British West Indian (17.7%, a difference of 0.070%), German Russian (17.7%, a difference of 0.13%), Lebanese (17.7%, a difference of 0.28%), German (17.7%, a difference of 0.29%), and Iroquois (17.7%, a difference of 0.43%).
| Demographics | Rating | Rank | Single Father Poverty |
| Haitians | 0.3 /100 | #267 | Tragic 17.3% |
| Immigrants | Caribbean | 0.3 /100 | #268 | Tragic 17.4% |
| Slavs | 0.3 /100 | #269 | Tragic 17.4% |
| Indonesians | 0.2 /100 | #270 | Tragic 17.4% |
| French American Indians | 0.2 /100 | #271 | Tragic 17.4% |
| Barbadians | 0.1 /100 | #272 | Tragic 17.5% |
| Italians | 0.1 /100 | #273 | Tragic 17.5% |
| Macedonians | 0.1 /100 | #274 | Tragic 17.7% |
| British West Indians | 0.0 /100 | #275 | Tragic 17.7% |
| German Russians | 0.0 /100 | #276 | Tragic 17.7% |
| Lebanese | 0.0 /100 | #277 | Tragic 17.7% |
| Germans | 0.0 /100 | #278 | Tragic 17.7% |
| Iroquois | 0.0 /100 | #279 | Tragic 17.7% |
| Scottish | 0.0 /100 | #280 | Tragic 17.7% |
| English | 0.0 /100 | #281 | Tragic 17.8% |