Russian vs Immigrants from Dominican Republic Child Poverty Among Girls Under 16
COMPARE
Russian
Immigrants from Dominican Republic
Child Poverty Among Girls Under 16
Child Poverty Among Girls Under 16 Comparison
Russians
Immigrants from Dominican Republic
13.9%
CHILD POVERTY AMONG GIRLS UNDER 16
99.6/ 100
METRIC RATING
36th/ 347
METRIC RANK
23.8%
CHILD POVERTY AMONG GIRLS UNDER 16
0.0/ 100
METRIC RATING
330th/ 347
METRIC RANK
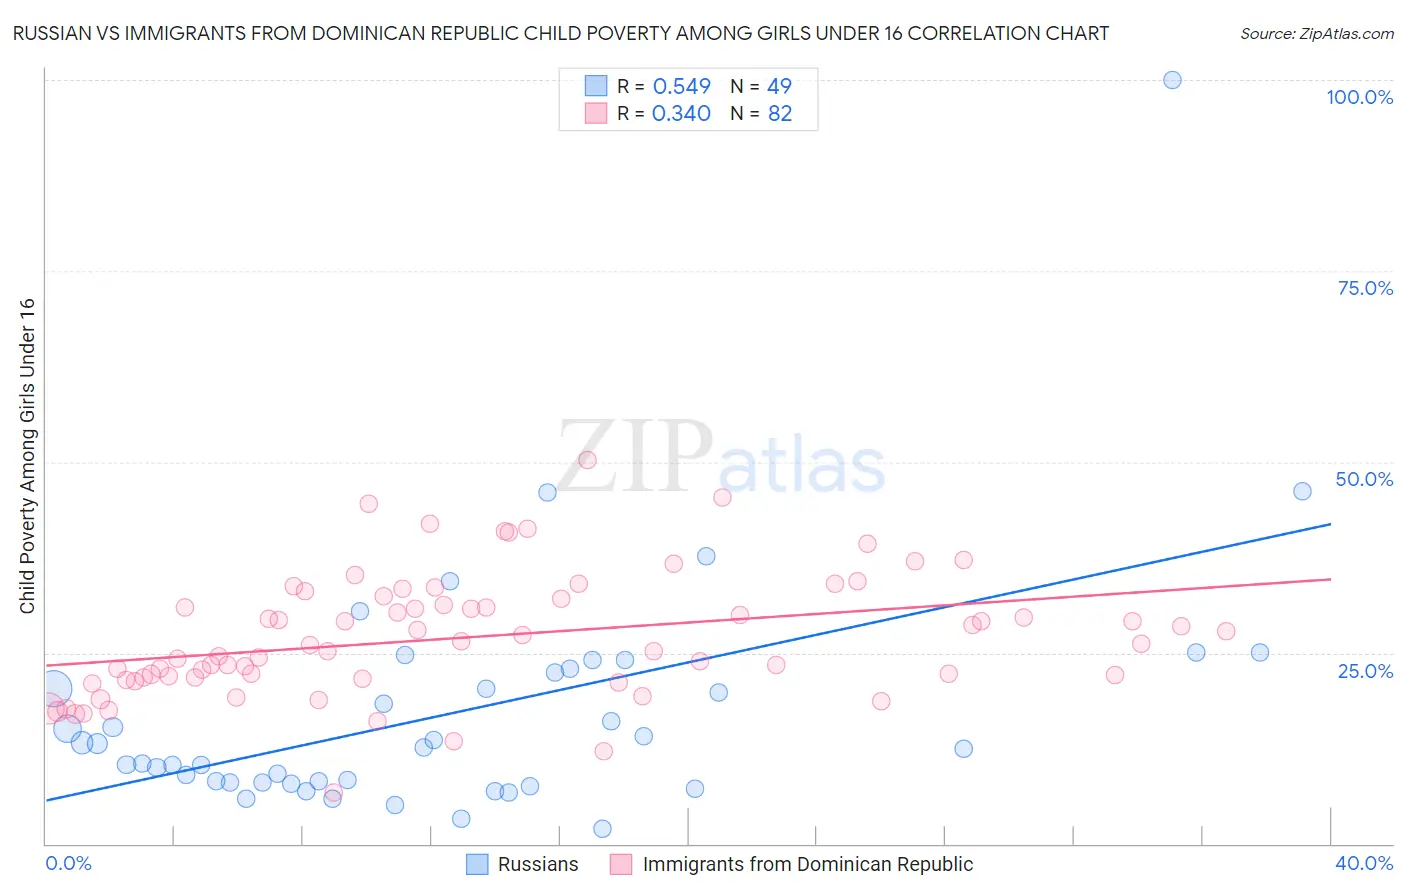
Russian vs Immigrants from Dominican Republic Child Poverty Among Girls Under 16 Correlation Chart
The statistical analysis conducted on geographies consisting of 495,383,256 people shows a substantial positive correlation between the proportion of Russians and poverty level among girls under the age of 16 in the United States with a correlation coefficient (R) of 0.549 and weighted average of 13.9%. Similarly, the statistical analysis conducted on geographies consisting of 271,039,828 people shows a mild positive correlation between the proportion of Immigrants from Dominican Republic and poverty level among girls under the age of 16 in the United States with a correlation coefficient (R) of 0.340 and weighted average of 23.8%, a difference of 71.9%.
Child Poverty Among Girls Under 16 Correlation Summary
| Measurement | Russian | Immigrants from Dominican Republic |
| Minimum | 1.9% | 6.6% |
| Maximum | 100.0% | 50.3% |
| Range | 98.1% | 43.6% |
| Mean | 17.2% | 27.0% |
| Median | 12.5% | 26.1% |
| Interquartile 25% (IQ1) | 8.0% | 21.7% |
| Interquartile 75% (IQ3) | 22.6% | 32.1% |
| Interquartile Range (IQR) | 14.6% | 10.4% |
| Standard Deviation (Sample) | 15.9% | 8.1% |
| Standard Deviation (Population) | 15.7% | 8.1% |
Similar Demographics by Child Poverty Among Girls Under 16
Demographics Similar to Russians by Child Poverty Among Girls Under 16
In terms of child poverty among girls under 16, the demographic groups most similar to Russians are Lithuanian (13.9%, a difference of 0.020%), Immigrants from Northern Europe (13.8%, a difference of 0.15%), Immigrants from Moldova (13.9%, a difference of 0.32%), Immigrants from Australia (14.0%, a difference of 0.97%), and Immigrants from Sri Lanka (14.0%, a difference of 1.1%).
| Demographics | Rating | Rank | Child Poverty Among Girls Under 16 |
| Bolivians | 99.8 /100 | #29 | Exceptional 13.6% |
| Asians | 99.7 /100 | #30 | Exceptional 13.7% |
| Turks | 99.7 /100 | #31 | Exceptional 13.7% |
| Danes | 99.7 /100 | #32 | Exceptional 13.7% |
| Swedes | 99.7 /100 | #33 | Exceptional 13.7% |
| Maltese | 99.7 /100 | #34 | Exceptional 13.7% |
| Immigrants | Northern Europe | 99.6 /100 | #35 | Exceptional 13.8% |
| Russians | 99.6 /100 | #36 | Exceptional 13.9% |
| Lithuanians | 99.6 /100 | #37 | Exceptional 13.9% |
| Immigrants | Moldova | 99.6 /100 | #38 | Exceptional 13.9% |
| Immigrants | Australia | 99.5 /100 | #39 | Exceptional 14.0% |
| Immigrants | Sri Lanka | 99.5 /100 | #40 | Exceptional 14.0% |
| Immigrants | Bolivia | 99.5 /100 | #41 | Exceptional 14.0% |
| Immigrants | Scotland | 99.4 /100 | #42 | Exceptional 14.0% |
| Koreans | 99.4 /100 | #43 | Exceptional 14.1% |
Demographics Similar to Immigrants from Dominican Republic by Child Poverty Among Girls Under 16
In terms of child poverty among girls under 16, the demographic groups most similar to Immigrants from Dominican Republic are Apache (23.8%, a difference of 0.050%), Kiowa (23.7%, a difference of 0.54%), Dominican (23.7%, a difference of 0.65%), Native/Alaskan (24.0%, a difference of 0.91%), and Black/African American (24.7%, a difference of 3.5%).
| Demographics | Rating | Rank | Child Poverty Among Girls Under 16 |
| Cajuns | 0.0 /100 | #323 | Tragic 22.6% |
| Paiute | 0.0 /100 | #324 | Tragic 22.6% |
| Immigrants | Congo | 0.0 /100 | #325 | Tragic 22.7% |
| Immigrants | Honduras | 0.0 /100 | #326 | Tragic 22.8% |
| Central American Indians | 0.0 /100 | #327 | Tragic 22.8% |
| Dominicans | 0.0 /100 | #328 | Tragic 23.7% |
| Kiowa | 0.0 /100 | #329 | Tragic 23.7% |
| Immigrants | Dominican Republic | 0.0 /100 | #330 | Tragic 23.8% |
| Apache | 0.0 /100 | #331 | Tragic 23.8% |
| Natives/Alaskans | 0.0 /100 | #332 | Tragic 24.0% |
| Blacks/African Americans | 0.0 /100 | #333 | Tragic 24.7% |
| Menominee | 0.0 /100 | #334 | Tragic 25.0% |
| Pueblo | 0.0 /100 | #335 | Tragic 25.2% |
| Sioux | 0.0 /100 | #336 | Tragic 25.6% |
| Yup'ik | 0.0 /100 | #337 | Tragic 25.8% |