French Canadian vs Immigrants from Bulgaria Poverty
COMPARE
French Canadian
Immigrants from Bulgaria
Poverty
Poverty Comparison
French Canadians
Immigrants from Bulgaria
11.6%
POVERTY
91.0/ 100
METRIC RATING
111th/ 347
METRIC RANK
11.1%
POVERTY
98.5/ 100
METRIC RATING
54th/ 347
METRIC RANK
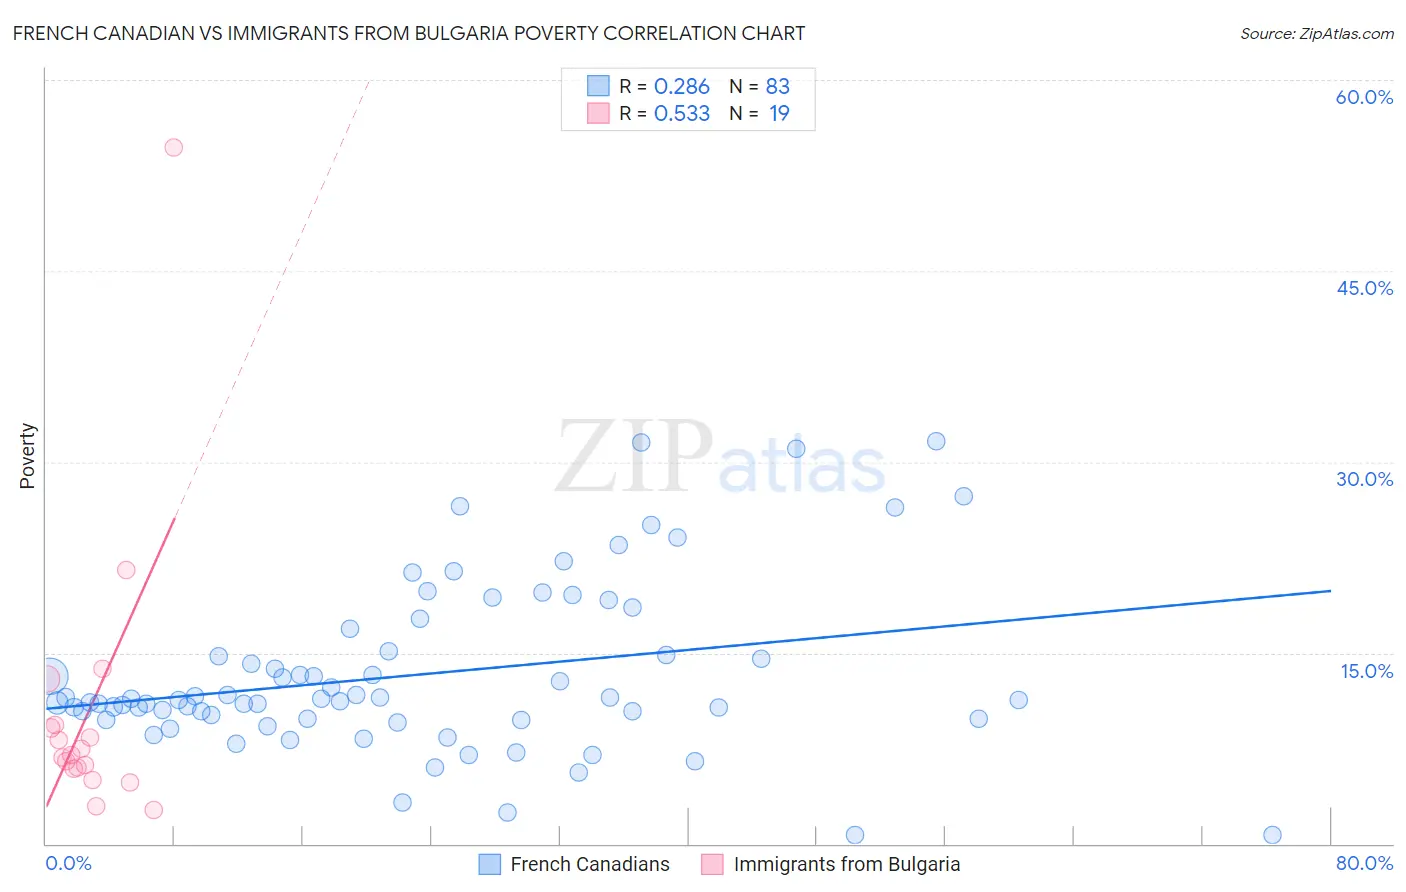
French Canadian vs Immigrants from Bulgaria Poverty Correlation Chart
The statistical analysis conducted on geographies consisting of 502,211,905 people shows a weak positive correlation between the proportion of French Canadians and poverty level in the United States with a correlation coefficient (R) of 0.286 and weighted average of 11.6%. Similarly, the statistical analysis conducted on geographies consisting of 172,536,486 people shows a substantial positive correlation between the proportion of Immigrants from Bulgaria and poverty level in the United States with a correlation coefficient (R) of 0.533 and weighted average of 11.1%, a difference of 5.1%.
Poverty Correlation Summary
| Measurement | French Canadian | Immigrants from Bulgaria |
| Minimum | 0.65% | 2.7% |
| Maximum | 31.6% | 54.7% |
| Range | 30.9% | 52.0% |
| Mean | 13.3% | 10.5% |
| Median | 11.3% | 7.0% |
| Interquartile 25% (IQ1) | 9.8% | 5.8% |
| Interquartile 75% (IQ3) | 15.1% | 9.4% |
| Interquartile Range (IQR) | 5.3% | 3.5% |
| Standard Deviation (Sample) | 6.6% | 11.5% |
| Standard Deviation (Population) | 6.5% | 11.2% |
Similar Demographics by Poverty
Demographics Similar to French Canadians by Poverty
In terms of poverty, the demographic groups most similar to French Canadians are Immigrants from Southern Europe (11.6%, a difference of 0.070%), Immigrants from Belarus (11.6%, a difference of 0.070%), Immigrants from China (11.6%, a difference of 0.090%), Welsh (11.6%, a difference of 0.17%), and Immigrants from Turkey (11.6%, a difference of 0.21%).
| Demographics | Rating | Rank | Poverty |
| Native Hawaiians | 92.1 /100 | #104 | Exceptional 11.6% |
| Portuguese | 92.1 /100 | #105 | Exceptional 11.6% |
| Immigrants | Zimbabwe | 92.1 /100 | #106 | Exceptional 11.6% |
| Palestinians | 91.8 /100 | #107 | Exceptional 11.6% |
| Canadians | 91.7 /100 | #108 | Exceptional 11.6% |
| Immigrants | Turkey | 91.7 /100 | #109 | Exceptional 11.6% |
| Welsh | 91.6 /100 | #110 | Exceptional 11.6% |
| French Canadians | 91.0 /100 | #111 | Exceptional 11.6% |
| Immigrants | Southern Europe | 90.8 /100 | #112 | Exceptional 11.6% |
| Immigrants | Belarus | 90.8 /100 | #113 | Exceptional 11.6% |
| Immigrants | China | 90.7 /100 | #114 | Exceptional 11.6% |
| Albanians | 90.3 /100 | #115 | Exceptional 11.7% |
| Immigrants | Russia | 89.7 /100 | #116 | Excellent 11.7% |
| Sri Lankans | 89.4 /100 | #117 | Excellent 11.7% |
| Argentineans | 89.1 /100 | #118 | Excellent 11.7% |
Demographics Similar to Immigrants from Bulgaria by Poverty
In terms of poverty, the demographic groups most similar to Immigrants from Bulgaria are Immigrants from Serbia (11.1%, a difference of 0.030%), Immigrants from Austria (11.1%, a difference of 0.12%), Immigrants from Philippines (11.0%, a difference of 0.34%), Immigrants from Croatia (11.0%, a difference of 0.36%), and Estonian (11.1%, a difference of 0.51%).
| Demographics | Rating | Rank | Poverty |
| Immigrants | Romania | 98.9 /100 | #47 | Exceptional 11.0% |
| Slovenes | 98.9 /100 | #48 | Exceptional 11.0% |
| Immigrants | Japan | 98.9 /100 | #49 | Exceptional 11.0% |
| Asians | 98.9 /100 | #50 | Exceptional 11.0% |
| Immigrants | Croatia | 98.7 /100 | #51 | Exceptional 11.0% |
| Immigrants | Philippines | 98.7 /100 | #52 | Exceptional 11.0% |
| Immigrants | Austria | 98.6 /100 | #53 | Exceptional 11.1% |
| Immigrants | Bulgaria | 98.5 /100 | #54 | Exceptional 11.1% |
| Immigrants | Serbia | 98.5 /100 | #55 | Exceptional 11.1% |
| Estonians | 98.2 /100 | #56 | Exceptional 11.1% |
| Scandinavians | 98.2 /100 | #57 | Exceptional 11.1% |
| Germans | 98.1 /100 | #58 | Exceptional 11.1% |
| Immigrants | Europe | 98.0 /100 | #59 | Exceptional 11.2% |
| Immigrants | Sri Lanka | 97.9 /100 | #60 | Exceptional 11.2% |
| Immigrants | Italy | 97.9 /100 | #61 | Exceptional 11.2% |