Crow vs Immigrants from Bulgaria Unemployment
COMPARE
Crow
Immigrants from Bulgaria
Unemployment
Unemployment Comparison
Crow
Immigrants from Bulgaria
11.1%
UNEMPLOYMENT
0.0/ 100
METRIC RATING
346th/ 347
METRIC RANK
4.9%
UNEMPLOYMENT
98.9/ 100
METRIC RATING
63rd/ 347
METRIC RANK
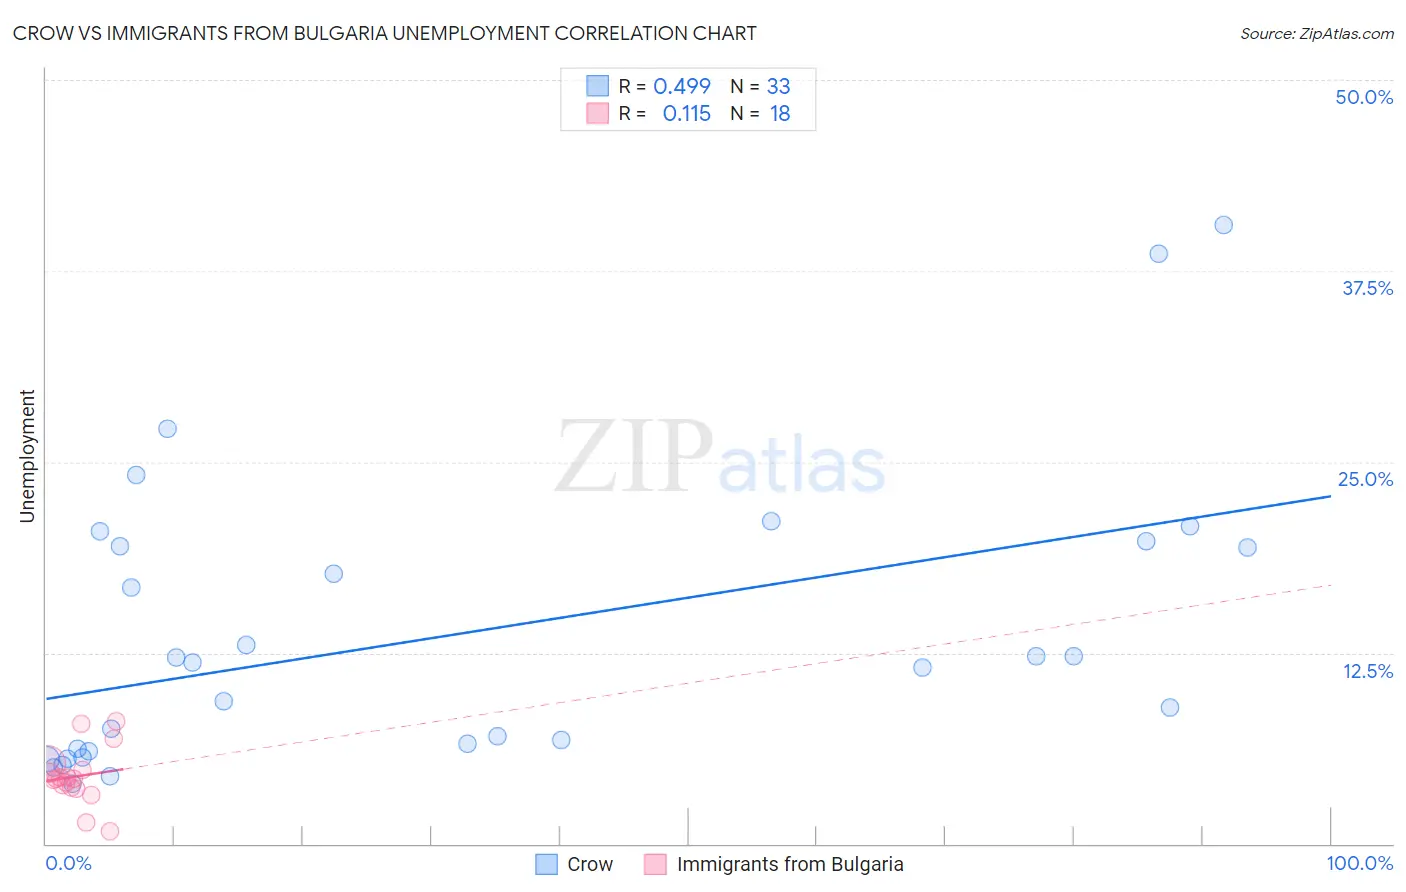
Crow vs Immigrants from Bulgaria Unemployment Correlation Chart
The statistical analysis conducted on geographies consisting of 59,183,327 people shows a moderate positive correlation between the proportion of Crow and unemployment in the United States with a correlation coefficient (R) of 0.499 and weighted average of 11.1%. Similarly, the statistical analysis conducted on geographies consisting of 172,511,279 people shows a poor positive correlation between the proportion of Immigrants from Bulgaria and unemployment in the United States with a correlation coefficient (R) of 0.115 and weighted average of 4.9%, a difference of 126.1%.
Unemployment Correlation Summary
| Measurement | Crow | Immigrants from Bulgaria |
| Minimum | 3.9% | 0.80% |
| Maximum | 40.5% | 8.0% |
| Range | 36.6% | 7.2% |
| Mean | 13.7% | 4.4% |
| Median | 11.9% | 4.2% |
| Interquartile 25% (IQ1) | 6.1% | 3.6% |
| Interquartile 75% (IQ3) | 19.6% | 4.9% |
| Interquartile Range (IQR) | 13.5% | 1.2% |
| Standard Deviation (Sample) | 9.3% | 1.8% |
| Standard Deviation (Population) | 9.2% | 1.8% |
Similar Demographics by Unemployment
Demographics Similar to Crow by Unemployment
In terms of unemployment, the demographic groups most similar to Crow are Inupiat (10.1%, a difference of 9.4%), Arapaho (9.8%, a difference of 12.6%), Yuman (9.1%, a difference of 22.0%), Yup'ik (13.6%, a difference of 23.3%), and Hopi (8.9%, a difference of 24.1%).
| Demographics | Rating | Rank | Unemployment |
| Immigrants | Dominican Republic | 0.0 /100 | #333 | Tragic 7.4% |
| Apache | 0.0 /100 | #334 | Tragic 7.4% |
| Alaskan Athabascans | 0.0 /100 | #335 | Tragic 7.7% |
| Immigrants | Yemen | 0.0 /100 | #336 | Tragic 7.7% |
| Cheyenne | 0.0 /100 | #337 | Tragic 8.0% |
| Pima | 0.0 /100 | #338 | Tragic 8.2% |
| Navajo | 0.0 /100 | #339 | Tragic 8.4% |
| Puerto Ricans | 0.0 /100 | #340 | Tragic 8.4% |
| Tohono O'odham | 0.0 /100 | #341 | Tragic 8.9% |
| Hopi | 0.0 /100 | #342 | Tragic 8.9% |
| Yuman | 0.0 /100 | #343 | Tragic 9.1% |
| Arapaho | 0.0 /100 | #344 | Tragic 9.8% |
| Inupiat | 0.0 /100 | #345 | Tragic 10.1% |
| Crow | 0.0 /100 | #346 | Tragic 11.1% |
| Yup'ik | 0.0 /100 | #347 | Tragic 13.6% |
Demographics Similar to Immigrants from Bulgaria by Unemployment
In terms of unemployment, the demographic groups most similar to Immigrants from Bulgaria are Icelander (4.9%, a difference of 0.010%), Immigrants from Netherlands (4.9%, a difference of 0.030%), Cambodian (4.9%, a difference of 0.030%), Bhutanese (4.9%, a difference of 0.070%), and Italian (4.9%, a difference of 0.080%).
| Demographics | Rating | Rank | Unemployment |
| Celtics | 99.1 /100 | #56 | Exceptional 4.9% |
| Immigrants | Singapore | 99.1 /100 | #57 | Exceptional 4.9% |
| Greeks | 99.0 /100 | #58 | Exceptional 4.9% |
| Bhutanese | 99.0 /100 | #59 | Exceptional 4.9% |
| Immigrants | Netherlands | 99.0 /100 | #60 | Exceptional 4.9% |
| Cambodians | 99.0 /100 | #61 | Exceptional 4.9% |
| Icelanders | 98.9 /100 | #62 | Exceptional 4.9% |
| Immigrants | Bulgaria | 98.9 /100 | #63 | Exceptional 4.9% |
| Italians | 98.9 /100 | #64 | Exceptional 4.9% |
| Immigrants | Canada | 98.8 /100 | #65 | Exceptional 4.9% |
| Slovaks | 98.7 /100 | #66 | Exceptional 4.9% |
| New Zealanders | 98.6 /100 | #67 | Exceptional 4.9% |
| Slavs | 98.6 /100 | #68 | Exceptional 4.9% |
| Immigrants | North America | 98.5 /100 | #69 | Exceptional 4.9% |
| Serbians | 98.4 /100 | #70 | Exceptional 4.9% |