Crow vs Bhutanese Single Male Poverty
COMPARE
Crow
Bhutanese
Single Male Poverty
Single Male Poverty Comparison
Crow
Bhutanese
23.3%
SINGLE MALE POVERTY
0.0/ 100
METRIC RATING
341st/ 347
METRIC RANK
11.1%
SINGLE MALE POVERTY
100.0/ 100
METRIC RATING
16th/ 347
METRIC RANK
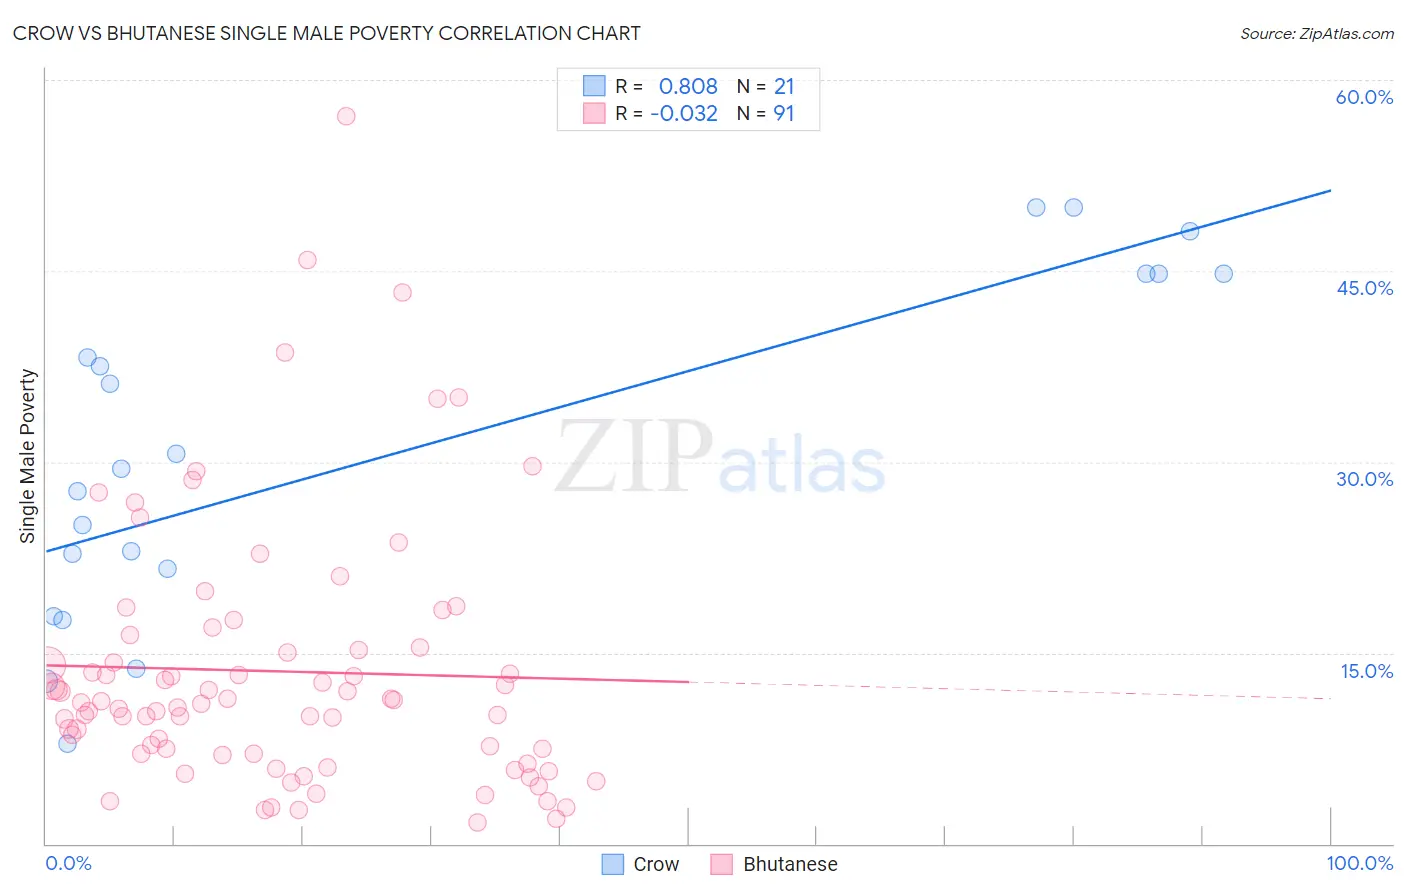
Crow vs Bhutanese Single Male Poverty Correlation Chart
The statistical analysis conducted on geographies consisting of 57,394,194 people shows a very strong positive correlation between the proportion of Crow and poverty level among single males in the United States with a correlation coefficient (R) of 0.808 and weighted average of 23.3%. Similarly, the statistical analysis conducted on geographies consisting of 397,447,211 people shows no correlation between the proportion of Bhutanese and poverty level among single males in the United States with a correlation coefficient (R) of -0.032 and weighted average of 11.1%, a difference of 110.1%.
Single Male Poverty Correlation Summary
| Measurement | Crow | Bhutanese |
| Minimum | 7.9% | 1.6% |
| Maximum | 50.0% | 57.1% |
| Range | 42.1% | 55.5% |
| Mean | 30.7% | 13.5% |
| Median | 29.4% | 11.1% |
| Interquartile 25% (IQ1) | 19.7% | 7.1% |
| Interquartile 75% (IQ3) | 44.8% | 15.5% |
| Interquartile Range (IQR) | 25.0% | 8.4% |
| Standard Deviation (Sample) | 13.2% | 10.2% |
| Standard Deviation (Population) | 12.9% | 10.2% |
Similar Demographics by Single Male Poverty
Demographics Similar to Crow by Single Male Poverty
In terms of single male poverty, the demographic groups most similar to Crow are Houma (23.5%, a difference of 0.82%), Sioux (22.2%, a difference of 4.7%), Arapaho (21.9%, a difference of 6.0%), Pueblo (21.6%, a difference of 7.6%), and Puerto Rican (25.1%, a difference of 7.8%).
| Demographics | Rating | Rank | Single Male Poverty |
| Inupiat | 0.0 /100 | #333 | Tragic 20.0% |
| Pima | 0.0 /100 | #334 | Tragic 20.2% |
| Yuman | 0.0 /100 | #335 | Tragic 21.3% |
| Tohono O'odham | 0.0 /100 | #336 | Tragic 21.6% |
| Apache | 0.0 /100 | #337 | Tragic 21.6% |
| Pueblo | 0.0 /100 | #338 | Tragic 21.6% |
| Arapaho | 0.0 /100 | #339 | Tragic 21.9% |
| Sioux | 0.0 /100 | #340 | Tragic 22.2% |
| Crow | 0.0 /100 | #341 | Tragic 23.3% |
| Houma | 0.0 /100 | #342 | Tragic 23.5% |
| Puerto Ricans | 0.0 /100 | #343 | Tragic 25.1% |
| Lumbee | 0.0 /100 | #344 | Tragic 25.2% |
| Navajo | 0.0 /100 | #345 | Tragic 25.3% |
| Hopi | 0.0 /100 | #346 | Tragic 27.5% |
| Yup'ik | 0.0 /100 | #347 | Tragic 31.6% |
Demographics Similar to Bhutanese by Single Male Poverty
In terms of single male poverty, the demographic groups most similar to Bhutanese are Tsimshian (11.1%, a difference of 0.090%), Immigrants from Bolivia (11.1%, a difference of 0.42%), Korean (11.0%, a difference of 0.75%), Chinese (11.0%, a difference of 0.81%), and Immigrants from Moldova (11.2%, a difference of 0.81%).
| Demographics | Rating | Rank | Single Male Poverty |
| Taiwanese | 100.0 /100 | #9 | Exceptional 10.9% |
| Immigrants | Fiji | 100.0 /100 | #10 | Exceptional 10.9% |
| Immigrants | Philippines | 100.0 /100 | #11 | Exceptional 10.9% |
| Immigrants | Afghanistan | 100.0 /100 | #12 | Exceptional 10.9% |
| Immigrants | South Central Asia | 100.0 /100 | #13 | Exceptional 10.9% |
| Chinese | 100.0 /100 | #14 | Exceptional 11.0% |
| Koreans | 100.0 /100 | #15 | Exceptional 11.0% |
| Bhutanese | 100.0 /100 | #16 | Exceptional 11.1% |
| Tsimshian | 100.0 /100 | #17 | Exceptional 11.1% |
| Immigrants | Bolivia | 100.0 /100 | #18 | Exceptional 11.1% |
| Immigrants | Moldova | 100.0 /100 | #19 | Exceptional 11.2% |
| Ethiopians | 100.0 /100 | #20 | Exceptional 11.2% |
| Asians | 100.0 /100 | #21 | Exceptional 11.2% |
| Immigrants | Pakistan | 100.0 /100 | #22 | Exceptional 11.2% |
| Bolivians | 100.0 /100 | #23 | Exceptional 11.2% |