Crow vs Immigrants from Syria Single Male Poverty
COMPARE
Crow
Immigrants from Syria
Single Male Poverty
Single Male Poverty Comparison
Crow
Immigrants from Syria
23.3%
SINGLE MALE POVERTY
0.0/ 100
METRIC RATING
341st/ 347
METRIC RANK
12.4%
SINGLE MALE POVERTY
91.2/ 100
METRIC RATING
116th/ 347
METRIC RANK
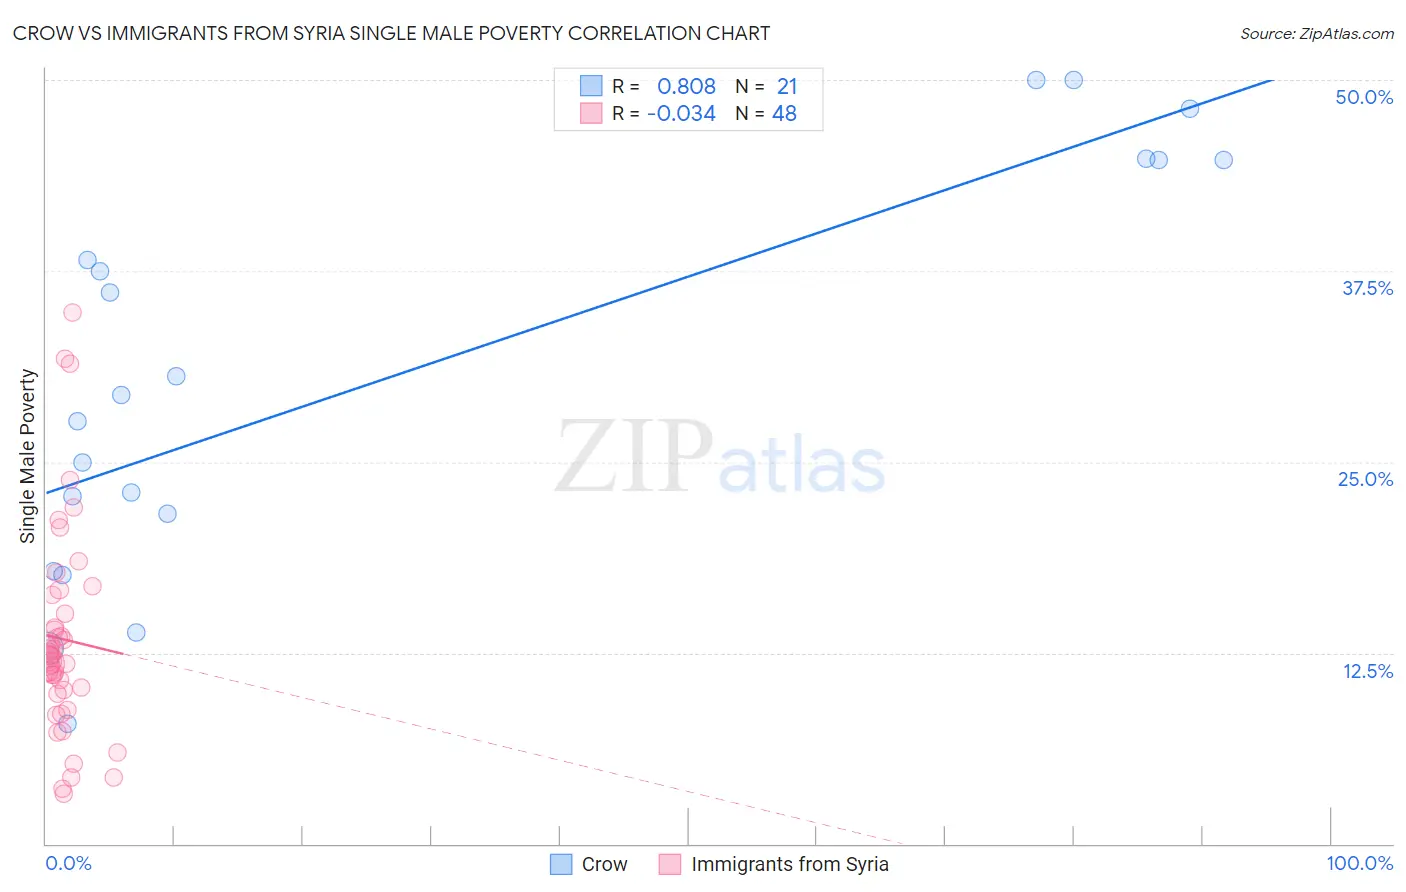
Crow vs Immigrants from Syria Single Male Poverty Correlation Chart
The statistical analysis conducted on geographies consisting of 57,394,194 people shows a very strong positive correlation between the proportion of Crow and poverty level among single males in the United States with a correlation coefficient (R) of 0.808 and weighted average of 23.3%. Similarly, the statistical analysis conducted on geographies consisting of 162,303,345 people shows no correlation between the proportion of Immigrants from Syria and poverty level among single males in the United States with a correlation coefficient (R) of -0.034 and weighted average of 12.4%, a difference of 87.5%.
Single Male Poverty Correlation Summary
| Measurement | Crow | Immigrants from Syria |
| Minimum | 7.9% | 3.3% |
| Maximum | 50.0% | 34.8% |
| Range | 42.1% | 31.5% |
| Mean | 30.7% | 13.4% |
| Median | 29.4% | 12.1% |
| Interquartile 25% (IQ1) | 19.7% | 9.9% |
| Interquartile 75% (IQ3) | 44.8% | 15.7% |
| Interquartile Range (IQR) | 25.0% | 5.8% |
| Standard Deviation (Sample) | 13.2% | 6.8% |
| Standard Deviation (Population) | 12.9% | 6.8% |
Similar Demographics by Single Male Poverty
Demographics Similar to Crow by Single Male Poverty
In terms of single male poverty, the demographic groups most similar to Crow are Houma (23.5%, a difference of 0.82%), Sioux (22.2%, a difference of 4.7%), Arapaho (21.9%, a difference of 6.0%), Pueblo (21.6%, a difference of 7.6%), and Puerto Rican (25.1%, a difference of 7.8%).
| Demographics | Rating | Rank | Single Male Poverty |
| Inupiat | 0.0 /100 | #333 | Tragic 20.0% |
| Pima | 0.0 /100 | #334 | Tragic 20.2% |
| Yuman | 0.0 /100 | #335 | Tragic 21.3% |
| Tohono O'odham | 0.0 /100 | #336 | Tragic 21.6% |
| Apache | 0.0 /100 | #337 | Tragic 21.6% |
| Pueblo | 0.0 /100 | #338 | Tragic 21.6% |
| Arapaho | 0.0 /100 | #339 | Tragic 21.9% |
| Sioux | 0.0 /100 | #340 | Tragic 22.2% |
| Crow | 0.0 /100 | #341 | Tragic 23.3% |
| Houma | 0.0 /100 | #342 | Tragic 23.5% |
| Puerto Ricans | 0.0 /100 | #343 | Tragic 25.1% |
| Lumbee | 0.0 /100 | #344 | Tragic 25.2% |
| Navajo | 0.0 /100 | #345 | Tragic 25.3% |
| Hopi | 0.0 /100 | #346 | Tragic 27.5% |
| Yup'ik | 0.0 /100 | #347 | Tragic 31.6% |
Demographics Similar to Immigrants from Syria by Single Male Poverty
In terms of single male poverty, the demographic groups most similar to Immigrants from Syria are Immigrants from Oceania (12.4%, a difference of 0.010%), Immigrants from Southern Europe (12.4%, a difference of 0.060%), Albanian (12.4%, a difference of 0.11%), Immigrants from Albania (12.4%, a difference of 0.14%), and Nicaraguan (12.4%, a difference of 0.16%).
| Demographics | Rating | Rank | Single Male Poverty |
| Ugandans | 94.5 /100 | #109 | Exceptional 12.3% |
| Immigrants | Portugal | 93.6 /100 | #110 | Exceptional 12.3% |
| Immigrants | North Macedonia | 93.6 /100 | #111 | Exceptional 12.3% |
| Kenyans | 93.3 /100 | #112 | Exceptional 12.4% |
| Pakistanis | 92.4 /100 | #113 | Exceptional 12.4% |
| Nicaraguans | 92.1 /100 | #114 | Exceptional 12.4% |
| Immigrants | Southern Europe | 91.5 /100 | #115 | Exceptional 12.4% |
| Immigrants | Syria | 91.2 /100 | #116 | Exceptional 12.4% |
| Immigrants | Oceania | 91.1 /100 | #117 | Exceptional 12.4% |
| Albanians | 90.6 /100 | #118 | Exceptional 12.4% |
| Immigrants | Albania | 90.3 /100 | #119 | Exceptional 12.4% |
| Venezuelans | 89.4 /100 | #120 | Excellent 12.4% |
| Icelanders | 88.2 /100 | #121 | Excellent 12.5% |
| Serbians | 87.9 /100 | #122 | Excellent 12.5% |
| Immigrants | Kenya | 87.6 /100 | #123 | Excellent 12.5% |