French American Indian vs Bhutanese Single Male Poverty
COMPARE
French American Indian
Bhutanese
Single Male Poverty
Single Male Poverty Comparison
French American Indians
Bhutanese
15.0%
SINGLE MALE POVERTY
0.0/ 100
METRIC RATING
298th/ 347
METRIC RANK
11.1%
SINGLE MALE POVERTY
100.0/ 100
METRIC RATING
16th/ 347
METRIC RANK
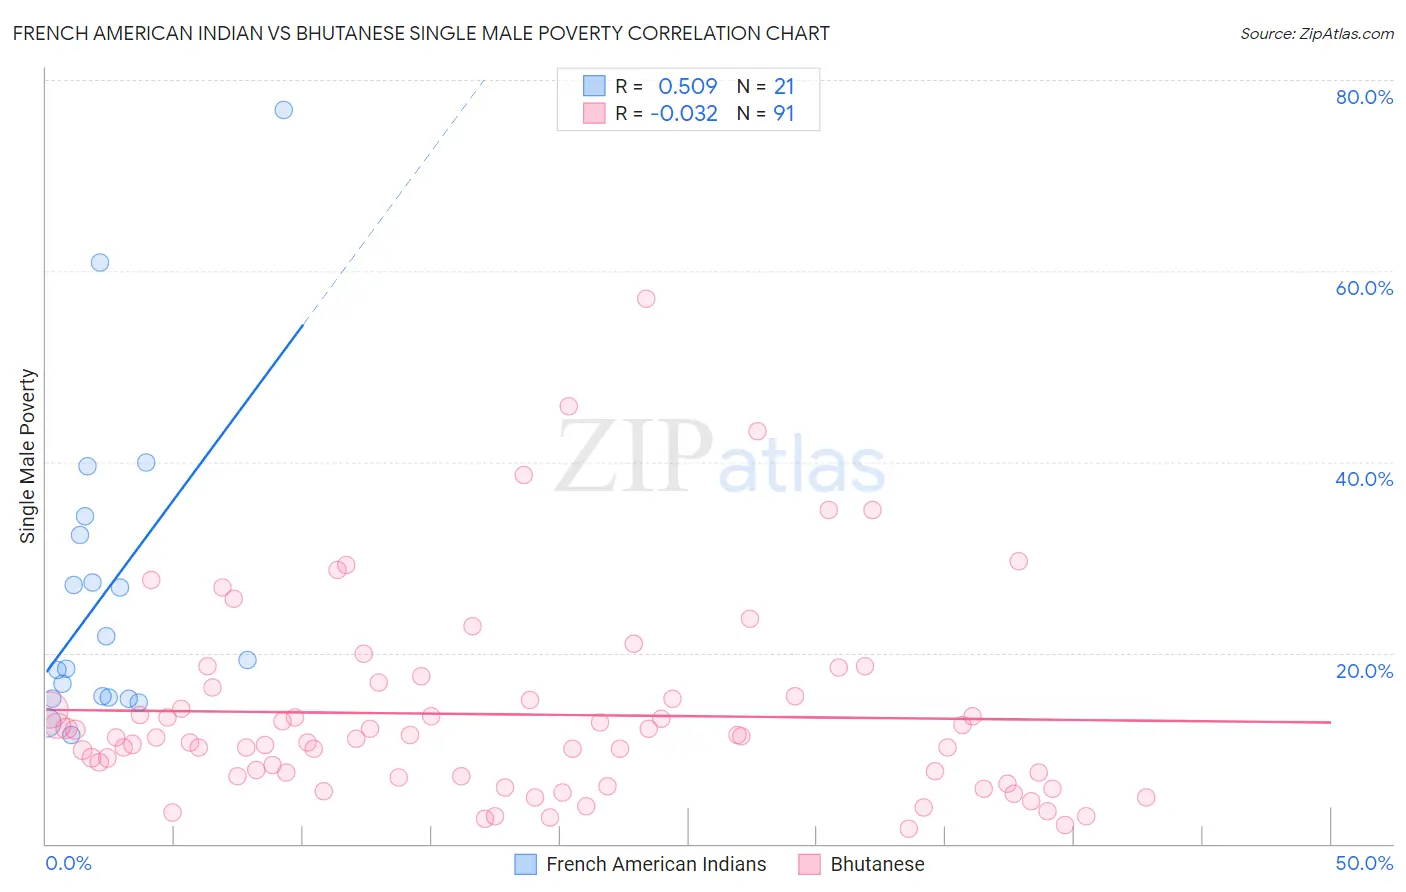
French American Indian vs Bhutanese Single Male Poverty Correlation Chart
The statistical analysis conducted on geographies consisting of 125,004,458 people shows a substantial positive correlation between the proportion of French American Indians and poverty level among single males in the United States with a correlation coefficient (R) of 0.509 and weighted average of 15.0%. Similarly, the statistical analysis conducted on geographies consisting of 397,447,211 people shows no correlation between the proportion of Bhutanese and poverty level among single males in the United States with a correlation coefficient (R) of -0.032 and weighted average of 11.1%, a difference of 35.2%.
Single Male Poverty Correlation Summary
| Measurement | French American Indian | Bhutanese |
| Minimum | 11.4% | 1.6% |
| Maximum | 76.9% | 57.1% |
| Range | 65.5% | 55.5% |
| Mean | 26.7% | 13.5% |
| Median | 19.2% | 11.1% |
| Interquartile 25% (IQ1) | 15.3% | 7.1% |
| Interquartile 75% (IQ3) | 33.3% | 15.5% |
| Interquartile Range (IQR) | 18.0% | 8.4% |
| Standard Deviation (Sample) | 16.6% | 10.2% |
| Standard Deviation (Population) | 16.2% | 10.2% |
Similar Demographics by Single Male Poverty
Demographics Similar to French American Indians by Single Male Poverty
In terms of single male poverty, the demographic groups most similar to French American Indians are Delaware (15.0%, a difference of 0.39%), Cree (15.1%, a difference of 0.84%), Immigrants from Dominican Republic (14.8%, a difference of 1.3%), African (14.7%, a difference of 1.6%), and Dominican (15.2%, a difference of 1.7%).
| Demographics | Rating | Rank | Single Male Poverty |
| Bahamians | 0.0 /100 | #291 | Tragic 14.6% |
| Immigrants | Nonimmigrants | 0.0 /100 | #292 | Tragic 14.6% |
| French Canadians | 0.0 /100 | #293 | Tragic 14.6% |
| Ottawa | 0.0 /100 | #294 | Tragic 14.6% |
| Scotch-Irish | 0.0 /100 | #295 | Tragic 14.7% |
| Africans | 0.0 /100 | #296 | Tragic 14.7% |
| Immigrants | Dominican Republic | 0.0 /100 | #297 | Tragic 14.8% |
| French American Indians | 0.0 /100 | #298 | Tragic 15.0% |
| Delaware | 0.0 /100 | #299 | Tragic 15.0% |
| Cree | 0.0 /100 | #300 | Tragic 15.1% |
| Dominicans | 0.0 /100 | #301 | Tragic 15.2% |
| Alsatians | 0.0 /100 | #302 | Tragic 15.2% |
| Aleuts | 0.0 /100 | #303 | Tragic 15.4% |
| Alaska Natives | 0.0 /100 | #304 | Tragic 15.4% |
| Blackfeet | 0.0 /100 | #305 | Tragic 15.5% |
Demographics Similar to Bhutanese by Single Male Poverty
In terms of single male poverty, the demographic groups most similar to Bhutanese are Tsimshian (11.1%, a difference of 0.090%), Immigrants from Bolivia (11.1%, a difference of 0.42%), Korean (11.0%, a difference of 0.75%), Chinese (11.0%, a difference of 0.81%), and Immigrants from Moldova (11.2%, a difference of 0.81%).
| Demographics | Rating | Rank | Single Male Poverty |
| Taiwanese | 100.0 /100 | #9 | Exceptional 10.9% |
| Immigrants | Fiji | 100.0 /100 | #10 | Exceptional 10.9% |
| Immigrants | Philippines | 100.0 /100 | #11 | Exceptional 10.9% |
| Immigrants | Afghanistan | 100.0 /100 | #12 | Exceptional 10.9% |
| Immigrants | South Central Asia | 100.0 /100 | #13 | Exceptional 10.9% |
| Chinese | 100.0 /100 | #14 | Exceptional 11.0% |
| Koreans | 100.0 /100 | #15 | Exceptional 11.0% |
| Bhutanese | 100.0 /100 | #16 | Exceptional 11.1% |
| Tsimshian | 100.0 /100 | #17 | Exceptional 11.1% |
| Immigrants | Bolivia | 100.0 /100 | #18 | Exceptional 11.1% |
| Immigrants | Moldova | 100.0 /100 | #19 | Exceptional 11.2% |
| Ethiopians | 100.0 /100 | #20 | Exceptional 11.2% |
| Asians | 100.0 /100 | #21 | Exceptional 11.2% |
| Immigrants | Pakistan | 100.0 /100 | #22 | Exceptional 11.2% |
| Bolivians | 100.0 /100 | #23 | Exceptional 11.2% |