Crow vs German Single Male Poverty
COMPARE
Crow
German
Single Male Poverty
Single Male Poverty Comparison
Crow
Germans
23.3%
SINGLE MALE POVERTY
0.0/ 100
METRIC RATING
341st/ 347
METRIC RANK
13.9%
SINGLE MALE POVERTY
0.1/ 100
METRIC RATING
267th/ 347
METRIC RANK
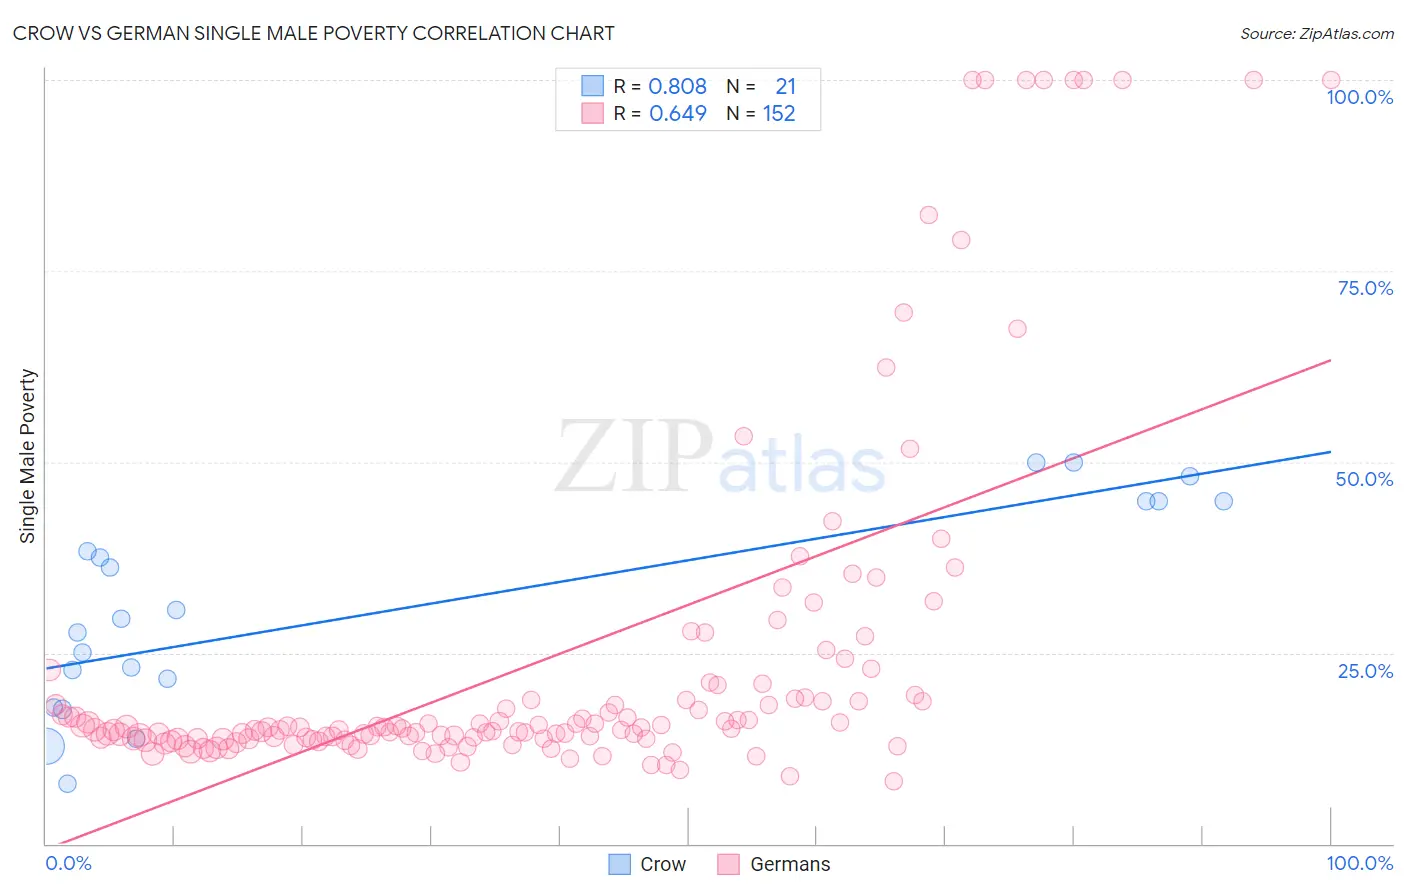
Crow vs German Single Male Poverty Correlation Chart
The statistical analysis conducted on geographies consisting of 57,394,194 people shows a very strong positive correlation between the proportion of Crow and poverty level among single males in the United States with a correlation coefficient (R) of 0.808 and weighted average of 23.3%. Similarly, the statistical analysis conducted on geographies consisting of 476,219,018 people shows a significant positive correlation between the proportion of Germans and poverty level among single males in the United States with a correlation coefficient (R) of 0.649 and weighted average of 13.9%, a difference of 66.9%.
Single Male Poverty Correlation Summary
| Measurement | Crow | German |
| Minimum | 7.9% | 8.2% |
| Maximum | 50.0% | 100.0% |
| Range | 42.1% | 91.8% |
| Mean | 30.7% | 23.9% |
| Median | 29.4% | 15.1% |
| Interquartile 25% (IQ1) | 19.7% | 13.8% |
| Interquartile 75% (IQ3) | 44.8% | 19.0% |
| Interquartile Range (IQR) | 25.0% | 5.3% |
| Standard Deviation (Sample) | 13.2% | 22.7% |
| Standard Deviation (Population) | 12.9% | 22.7% |
Similar Demographics by Single Male Poverty
Demographics Similar to Crow by Single Male Poverty
In terms of single male poverty, the demographic groups most similar to Crow are Houma (23.5%, a difference of 0.82%), Sioux (22.2%, a difference of 4.7%), Arapaho (21.9%, a difference of 6.0%), Pueblo (21.6%, a difference of 7.6%), and Puerto Rican (25.1%, a difference of 7.8%).
| Demographics | Rating | Rank | Single Male Poverty |
| Inupiat | 0.0 /100 | #333 | Tragic 20.0% |
| Pima | 0.0 /100 | #334 | Tragic 20.2% |
| Yuman | 0.0 /100 | #335 | Tragic 21.3% |
| Tohono O'odham | 0.0 /100 | #336 | Tragic 21.6% |
| Apache | 0.0 /100 | #337 | Tragic 21.6% |
| Pueblo | 0.0 /100 | #338 | Tragic 21.6% |
| Arapaho | 0.0 /100 | #339 | Tragic 21.9% |
| Sioux | 0.0 /100 | #340 | Tragic 22.2% |
| Crow | 0.0 /100 | #341 | Tragic 23.3% |
| Houma | 0.0 /100 | #342 | Tragic 23.5% |
| Puerto Ricans | 0.0 /100 | #343 | Tragic 25.1% |
| Lumbee | 0.0 /100 | #344 | Tragic 25.2% |
| Navajo | 0.0 /100 | #345 | Tragic 25.3% |
| Hopi | 0.0 /100 | #346 | Tragic 27.5% |
| Yup'ik | 0.0 /100 | #347 | Tragic 31.6% |
Demographics Similar to Germans by Single Male Poverty
In terms of single male poverty, the demographic groups most similar to Germans are Immigrants from Mexico (13.9%, a difference of 0.070%), Immigrants from Cabo Verde (13.9%, a difference of 0.16%), Scottish (14.0%, a difference of 0.22%), Immigrants from Saudi Arabia (14.0%, a difference of 0.23%), and Irish (14.0%, a difference of 0.27%).
| Demographics | Rating | Rank | Single Male Poverty |
| Swiss | 0.3 /100 | #260 | Tragic 13.8% |
| Hungarians | 0.3 /100 | #261 | Tragic 13.8% |
| Fijians | 0.3 /100 | #262 | Tragic 13.8% |
| Cape Verdeans | 0.2 /100 | #263 | Tragic 13.8% |
| West Indians | 0.2 /100 | #264 | Tragic 13.8% |
| Immigrants | Congo | 0.2 /100 | #265 | Tragic 13.9% |
| Immigrants | Cabo Verde | 0.1 /100 | #266 | Tragic 13.9% |
| Germans | 0.1 /100 | #267 | Tragic 13.9% |
| Immigrants | Mexico | 0.1 /100 | #268 | Tragic 13.9% |
| Scottish | 0.1 /100 | #269 | Tragic 14.0% |
| Immigrants | Saudi Arabia | 0.1 /100 | #270 | Tragic 14.0% |
| Irish | 0.1 /100 | #271 | Tragic 14.0% |
| Mexicans | 0.1 /100 | #272 | Tragic 14.0% |
| Welsh | 0.1 /100 | #273 | Tragic 14.0% |
| Hondurans | 0.1 /100 | #274 | Tragic 14.0% |