Immigrants from Moldova vs Bhutanese Single Male Poverty
COMPARE
Immigrants from Moldova
Bhutanese
Single Male Poverty
Single Male Poverty Comparison
Immigrants from Moldova
Bhutanese
11.2%
SINGLE MALE POVERTY
100.0/ 100
METRIC RATING
19th/ 347
METRIC RANK
11.1%
SINGLE MALE POVERTY
100.0/ 100
METRIC RATING
16th/ 347
METRIC RANK
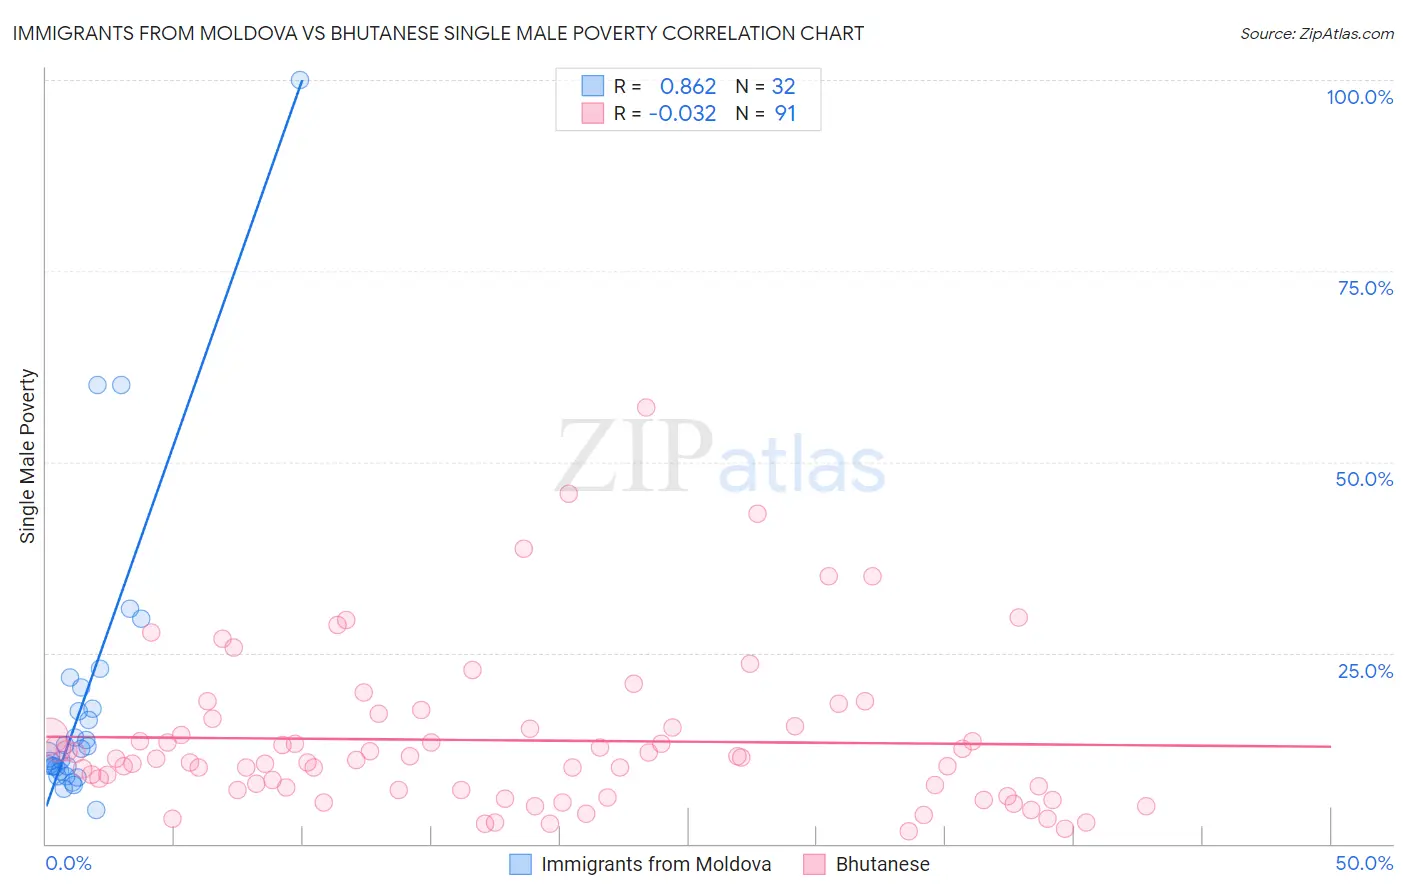
Immigrants from Moldova vs Bhutanese Single Male Poverty Correlation Chart
The statistical analysis conducted on geographies consisting of 116,791,948 people shows a very strong positive correlation between the proportion of Immigrants from Moldova and poverty level among single males in the United States with a correlation coefficient (R) of 0.862 and weighted average of 11.2%. Similarly, the statistical analysis conducted on geographies consisting of 397,447,211 people shows no correlation between the proportion of Bhutanese and poverty level among single males in the United States with a correlation coefficient (R) of -0.032 and weighted average of 11.1%, a difference of 0.81%.
Single Male Poverty Correlation Summary
| Measurement | Immigrants from Moldova | Bhutanese |
| Minimum | 4.3% | 1.6% |
| Maximum | 100.0% | 57.1% |
| Range | 95.7% | 55.5% |
| Mean | 19.0% | 13.5% |
| Median | 12.1% | 11.1% |
| Interquartile 25% (IQ1) | 9.7% | 7.1% |
| Interquartile 75% (IQ3) | 19.1% | 15.5% |
| Interquartile Range (IQR) | 9.4% | 8.4% |
| Standard Deviation (Sample) | 19.6% | 10.2% |
| Standard Deviation (Population) | 19.3% | 10.2% |
Demographics Similar to Immigrants from Moldova and Bhutanese by Single Male Poverty
In terms of single male poverty, the demographic groups most similar to Immigrants from Moldova are Ethiopian (11.2%, a difference of 0.020%), Asian (11.2%, a difference of 0.37%), Immigrants from Bolivia (11.1%, a difference of 0.38%), Immigrants from Pakistan (11.2%, a difference of 0.46%), and Bolivian (11.2%, a difference of 0.67%). Similarly, the demographic groups most similar to Bhutanese are Tsimshian (11.1%, a difference of 0.090%), Immigrants from Bolivia (11.1%, a difference of 0.42%), Korean (11.0%, a difference of 0.75%), Chinese (11.0%, a difference of 0.81%), and Ethiopian (11.2%, a difference of 0.83%).
| Demographics | Rating | Rank | Single Male Poverty |
| Afghans | 100.0 /100 | #7 | Exceptional 10.7% |
| Thais | 100.0 /100 | #8 | Exceptional 10.8% |
| Taiwanese | 100.0 /100 | #9 | Exceptional 10.9% |
| Immigrants | Fiji | 100.0 /100 | #10 | Exceptional 10.9% |
| Immigrants | Philippines | 100.0 /100 | #11 | Exceptional 10.9% |
| Immigrants | Afghanistan | 100.0 /100 | #12 | Exceptional 10.9% |
| Immigrants | South Central Asia | 100.0 /100 | #13 | Exceptional 10.9% |
| Chinese | 100.0 /100 | #14 | Exceptional 11.0% |
| Koreans | 100.0 /100 | #15 | Exceptional 11.0% |
| Bhutanese | 100.0 /100 | #16 | Exceptional 11.1% |
| Tsimshian | 100.0 /100 | #17 | Exceptional 11.1% |
| Immigrants | Bolivia | 100.0 /100 | #18 | Exceptional 11.1% |
| Immigrants | Moldova | 100.0 /100 | #19 | Exceptional 11.2% |
| Ethiopians | 100.0 /100 | #20 | Exceptional 11.2% |
| Asians | 100.0 /100 | #21 | Exceptional 11.2% |
| Immigrants | Pakistan | 100.0 /100 | #22 | Exceptional 11.2% |
| Bolivians | 100.0 /100 | #23 | Exceptional 11.2% |
| Indians (Asian) | 100.0 /100 | #24 | Exceptional 11.3% |
| Maltese | 100.0 /100 | #25 | Exceptional 11.3% |
| Immigrants | Japan | 100.0 /100 | #26 | Exceptional 11.3% |
| Immigrants | China | 100.0 /100 | #27 | Exceptional 11.4% |