Creek vs Dutch West Indian Poverty
COMPARE
Creek
Dutch West Indian
Poverty
Poverty Comparison
Creek
Dutch West Indians
15.6%
POVERTY
0.0/ 100
METRIC RATING
306th/ 347
METRIC RANK
15.6%
POVERTY
0.0/ 100
METRIC RATING
310th/ 347
METRIC RANK
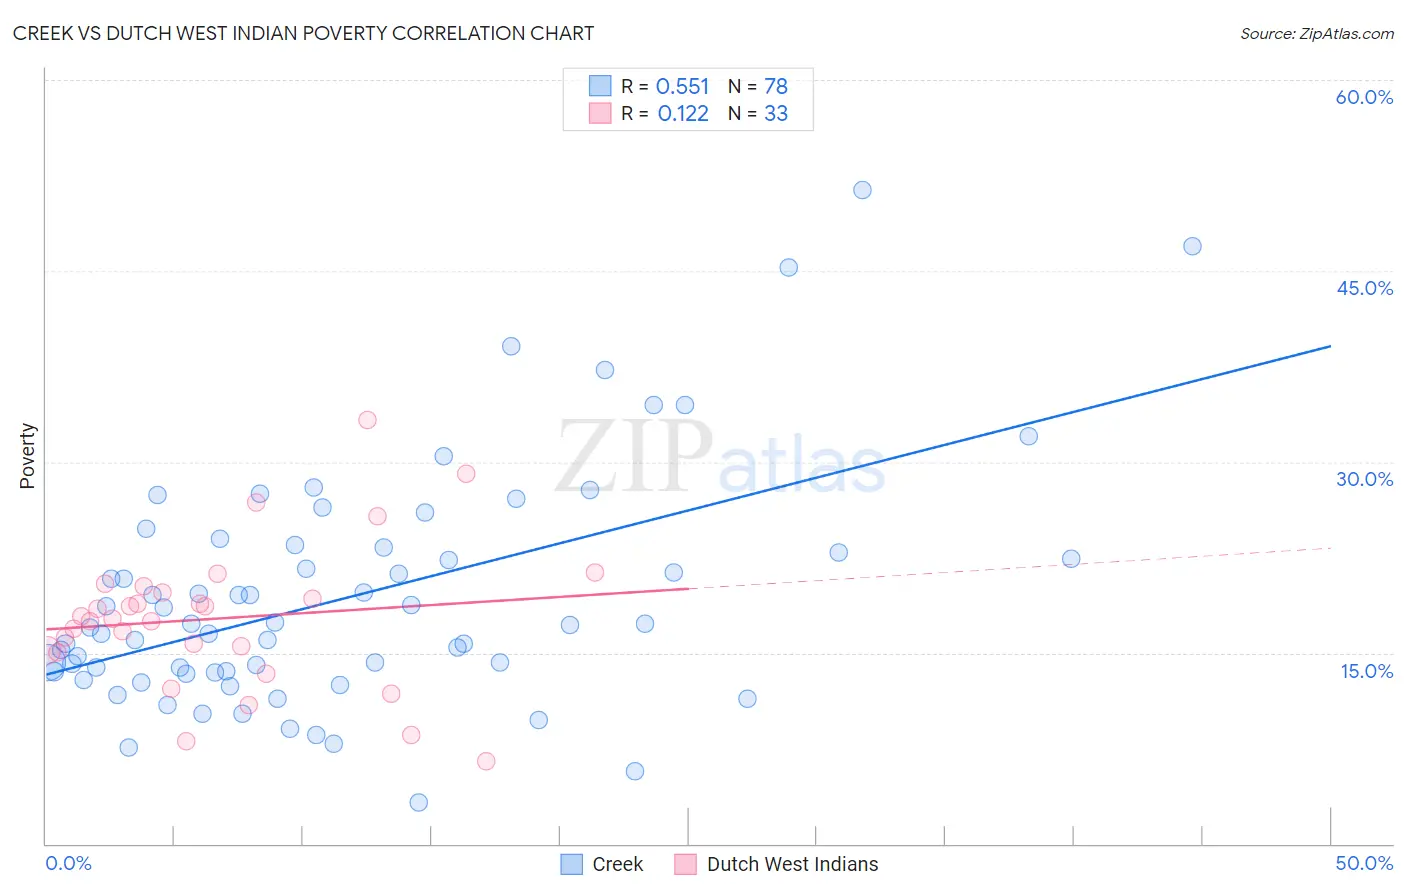
Creek vs Dutch West Indian Poverty Correlation Chart
The statistical analysis conducted on geographies consisting of 178,440,498 people shows a substantial positive correlation between the proportion of Creek and poverty level in the United States with a correlation coefficient (R) of 0.551 and weighted average of 15.6%. Similarly, the statistical analysis conducted on geographies consisting of 85,763,353 people shows a poor positive correlation between the proportion of Dutch West Indians and poverty level in the United States with a correlation coefficient (R) of 0.122 and weighted average of 15.6%, a difference of 0.32%.
Poverty Correlation Summary
| Measurement | Creek | Dutch West Indian |
| Minimum | 3.2% | 6.5% |
| Maximum | 51.4% | 33.3% |
| Range | 48.1% | 26.8% |
| Mean | 19.4% | 17.7% |
| Median | 17.2% | 17.7% |
| Interquartile 25% (IQ1) | 13.5% | 15.1% |
| Interquartile 75% (IQ3) | 23.3% | 20.0% |
| Interquartile Range (IQR) | 9.7% | 4.9% |
| Standard Deviation (Sample) | 9.2% | 5.7% |
| Standard Deviation (Population) | 9.2% | 5.6% |
Demographics Similar to Creek and Dutch West Indians by Poverty
In terms of poverty, the demographic groups most similar to Creek are African (15.6%, a difference of 0.070%), Choctaw (15.6%, a difference of 0.18%), Seminole (15.6%, a difference of 0.23%), Immigrants from Guatemala (15.5%, a difference of 0.44%), and Immigrants from Mexico (15.5%, a difference of 0.47%). Similarly, the demographic groups most similar to Dutch West Indians are Seminole (15.6%, a difference of 0.090%), Choctaw (15.6%, a difference of 0.13%), African (15.6%, a difference of 0.24%), Chippewa (15.7%, a difference of 0.39%), and Cajun (15.7%, a difference of 0.54%).
| Demographics | Rating | Rank | Poverty |
| Immigrants | Senegal | 0.0 /100 | #298 | Tragic 15.3% |
| Senegalese | 0.0 /100 | #299 | Tragic 15.3% |
| Immigrants | Central America | 0.0 /100 | #300 | Tragic 15.4% |
| Bahamians | 0.0 /100 | #301 | Tragic 15.4% |
| Somalis | 0.0 /100 | #302 | Tragic 15.4% |
| Immigrants | Caribbean | 0.0 /100 | #303 | Tragic 15.5% |
| Immigrants | Mexico | 0.0 /100 | #304 | Tragic 15.5% |
| Immigrants | Guatemala | 0.0 /100 | #305 | Tragic 15.5% |
| Creek | 0.0 /100 | #306 | Tragic 15.6% |
| Africans | 0.0 /100 | #307 | Tragic 15.6% |
| Choctaw | 0.0 /100 | #308 | Tragic 15.6% |
| Seminole | 0.0 /100 | #309 | Tragic 15.6% |
| Dutch West Indians | 0.0 /100 | #310 | Tragic 15.6% |
| Chippewa | 0.0 /100 | #311 | Tragic 15.7% |
| Cajuns | 0.0 /100 | #312 | Tragic 15.7% |
| Immigrants | Grenada | 0.0 /100 | #313 | Tragic 15.8% |
| Immigrants | Somalia | 0.0 /100 | #314 | Tragic 15.8% |
| British West Indians | 0.0 /100 | #315 | Tragic 15.9% |
| Hondurans | 0.0 /100 | #316 | Tragic 15.9% |
| U.S. Virgin Islanders | 0.0 /100 | #317 | Tragic 16.1% |
| Immigrants | Dominica | 0.0 /100 | #318 | Tragic 16.1% |