Salvadoran vs Immigrants from Hungary Female Poverty Among 18-24 Year Olds
COMPARE
Salvadoran
Immigrants from Hungary
Female Poverty Among 18-24 Year Olds
Female Poverty Among 18-24 Year Olds Comparison
Salvadorans
Immigrants from Hungary
19.1%
FEMALE POVERTY AMONG 18-24 YEAR OLDS
98.4/ 100
METRIC RATING
97th/ 347
METRIC RANK
19.3%
FEMALE POVERTY AMONG 18-24 YEAR OLDS
96.2/ 100
METRIC RATING
115th/ 347
METRIC RANK
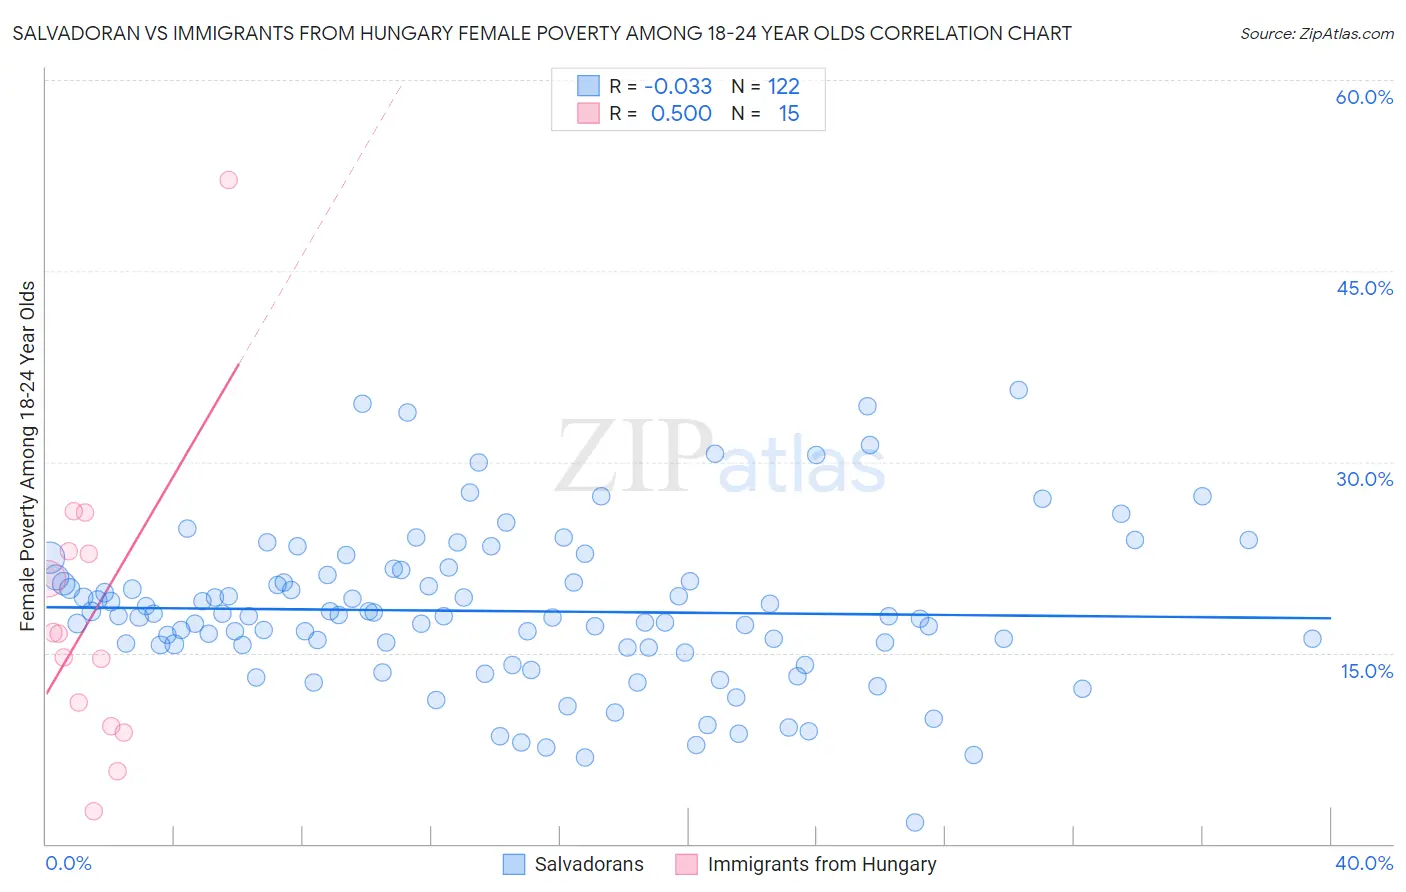
Salvadoran vs Immigrants from Hungary Female Poverty Among 18-24 Year Olds Correlation Chart
The statistical analysis conducted on geographies consisting of 390,935,430 people shows no correlation between the proportion of Salvadorans and poverty level among females between the ages 18 and 24 in the United States with a correlation coefficient (R) of -0.033 and weighted average of 19.1%. Similarly, the statistical analysis conducted on geographies consisting of 192,436,137 people shows a moderate positive correlation between the proportion of Immigrants from Hungary and poverty level among females between the ages 18 and 24 in the United States with a correlation coefficient (R) of 0.500 and weighted average of 19.3%, a difference of 1.1%.
Female Poverty Among 18-24 Year Olds Correlation Summary
| Measurement | Salvadoran | Immigrants from Hungary |
| Minimum | 1.7% | 2.6% |
| Maximum | 35.6% | 52.2% |
| Range | 34.0% | 49.6% |
| Mean | 18.3% | 18.0% |
| Median | 17.9% | 16.5% |
| Interquartile 25% (IQ1) | 15.4% | 9.2% |
| Interquartile 75% (IQ3) | 20.9% | 23.0% |
| Interquartile Range (IQR) | 5.5% | 13.7% |
| Standard Deviation (Sample) | 6.2% | 11.9% |
| Standard Deviation (Population) | 6.1% | 11.5% |
Demographics Similar to Salvadorans and Immigrants from Hungary by Female Poverty Among 18-24 Year Olds
In terms of female poverty among 18-24 year olds, the demographic groups most similar to Salvadorans are Immigrants from Jordan (19.1%, a difference of 0.010%), Immigrants from Czechoslovakia (19.1%, a difference of 0.080%), Chilean (19.1%, a difference of 0.10%), Ecuadorian (19.1%, a difference of 0.19%), and Immigrants from Caribbean (19.1%, a difference of 0.21%). Similarly, the demographic groups most similar to Immigrants from Hungary are Slovene (19.3%, a difference of 0.010%), Immigrants from Cameroon (19.3%, a difference of 0.050%), Immigrants (19.3%, a difference of 0.10%), Immigrants from El Salvador (19.3%, a difference of 0.11%), and Immigrants from Serbia (19.2%, a difference of 0.34%).
| Demographics | Rating | Rank | Female Poverty Among 18-24 Year Olds |
| Sierra Leoneans | 98.7 /100 | #96 | Exceptional 19.0% |
| Salvadorans | 98.4 /100 | #97 | Exceptional 19.1% |
| Immigrants | Jordan | 98.4 /100 | #98 | Exceptional 19.1% |
| Immigrants | Czechoslovakia | 98.3 /100 | #99 | Exceptional 19.1% |
| Chileans | 98.3 /100 | #100 | Exceptional 19.1% |
| Ecuadorians | 98.1 /100 | #101 | Exceptional 19.1% |
| Immigrants | Caribbean | 98.1 /100 | #102 | Exceptional 19.1% |
| Serbians | 98.0 /100 | #103 | Exceptional 19.1% |
| Immigrants | Afghanistan | 98.0 /100 | #104 | Exceptional 19.1% |
| Immigrants | Ecuador | 97.8 /100 | #105 | Exceptional 19.2% |
| Immigrants | Sierra Leone | 97.8 /100 | #106 | Exceptional 19.2% |
| Immigrants | Sri Lanka | 97.5 /100 | #107 | Exceptional 19.2% |
| Immigrants | Uzbekistan | 97.3 /100 | #108 | Exceptional 19.2% |
| Immigrants | Syria | 97.2 /100 | #109 | Exceptional 19.2% |
| Laotians | 97.1 /100 | #110 | Exceptional 19.2% |
| Immigrants | Serbia | 97.1 /100 | #111 | Exceptional 19.2% |
| Immigrants | El Salvador | 96.5 /100 | #112 | Exceptional 19.3% |
| Immigrants | Cameroon | 96.3 /100 | #113 | Exceptional 19.3% |
| Slovenes | 96.2 /100 | #114 | Exceptional 19.3% |
| Immigrants | Hungary | 96.2 /100 | #115 | Exceptional 19.3% |
| Immigrants | Immigrants | 95.9 /100 | #116 | Exceptional 19.3% |