Creek vs Immigrants from Eastern Asia Female Poverty Among 18-24 Year Olds
COMPARE
Creek
Immigrants from Eastern Asia
Female Poverty Among 18-24 Year Olds
Female Poverty Among 18-24 Year Olds Comparison
Creek
Immigrants from Eastern Asia
24.2%
FEMALE POVERTY AMONG 18-24 YEAR OLDS
0.0/ 100
METRIC RATING
313th/ 347
METRIC RANK
19.8%
FEMALE POVERTY AMONG 18-24 YEAR OLDS
79.7/ 100
METRIC RATING
151st/ 347
METRIC RANK
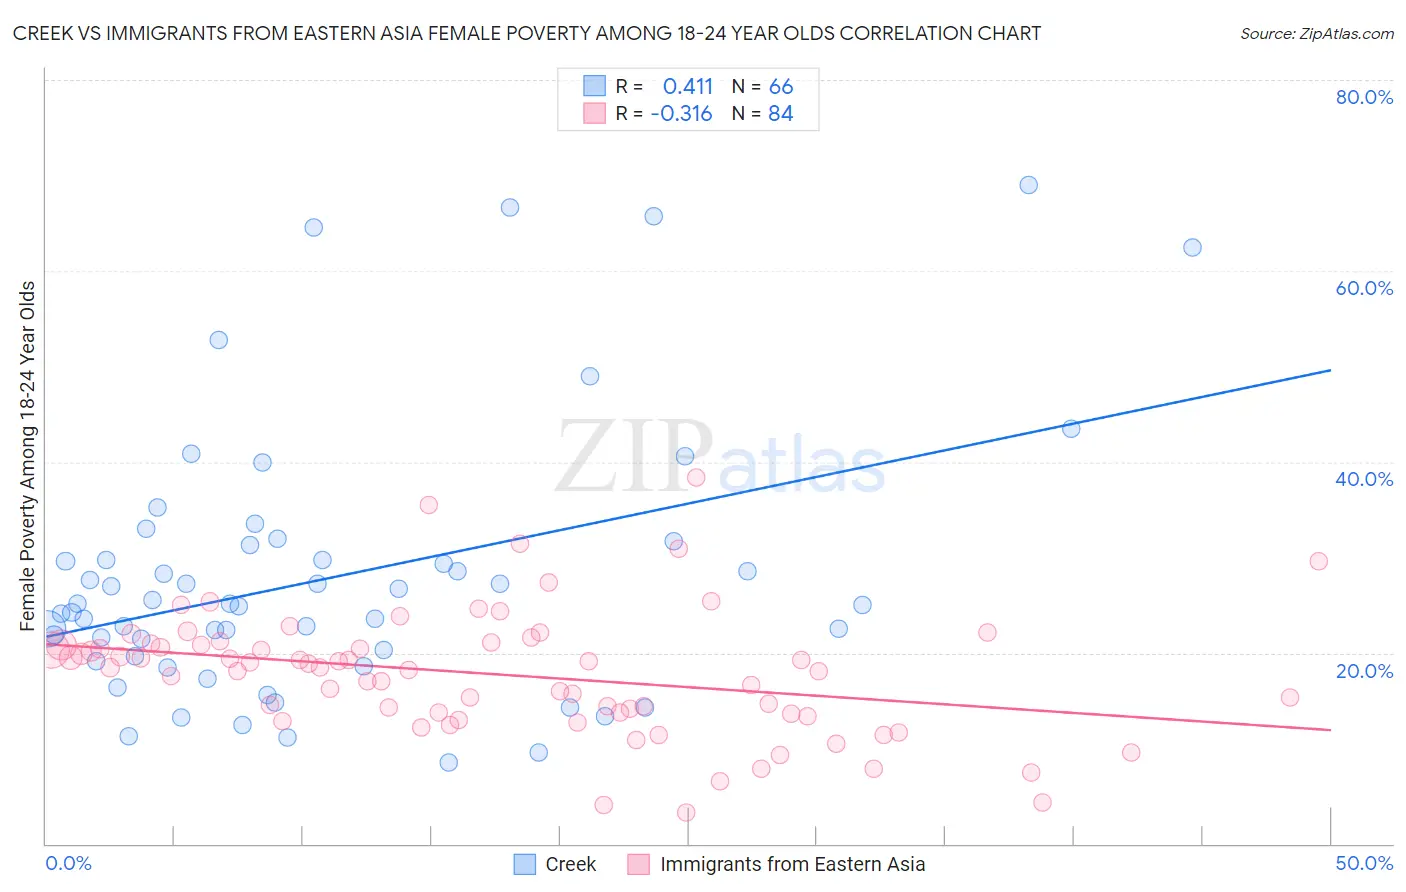
Creek vs Immigrants from Eastern Asia Female Poverty Among 18-24 Year Olds Correlation Chart
The statistical analysis conducted on geographies consisting of 176,646,944 people shows a moderate positive correlation between the proportion of Creek and poverty level among females between the ages 18 and 24 in the United States with a correlation coefficient (R) of 0.411 and weighted average of 24.2%. Similarly, the statistical analysis conducted on geographies consisting of 480,513,058 people shows a mild negative correlation between the proportion of Immigrants from Eastern Asia and poverty level among females between the ages 18 and 24 in the United States with a correlation coefficient (R) of -0.316 and weighted average of 19.8%, a difference of 22.6%.
Female Poverty Among 18-24 Year Olds Correlation Summary
| Measurement | Creek | Immigrants from Eastern Asia |
| Minimum | 8.5% | 3.2% |
| Maximum | 69.0% | 38.3% |
| Range | 60.4% | 35.1% |
| Mean | 28.0% | 17.8% |
| Median | 25.1% | 18.4% |
| Interquartile 25% (IQ1) | 19.7% | 13.6% |
| Interquartile 75% (IQ3) | 31.3% | 20.9% |
| Interquartile Range (IQR) | 11.7% | 7.3% |
| Standard Deviation (Sample) | 14.0% | 6.5% |
| Standard Deviation (Population) | 13.9% | 6.5% |
Similar Demographics by Female Poverty Among 18-24 Year Olds
Demographics Similar to Creek by Female Poverty Among 18-24 Year Olds
In terms of female poverty among 18-24 year olds, the demographic groups most similar to Creek are Choctaw (24.3%, a difference of 0.16%), Black/African American (24.3%, a difference of 0.36%), Alsatian (24.4%, a difference of 0.67%), Osage (24.5%, a difference of 0.97%), and Chickasaw (24.5%, a difference of 1.1%).
| Demographics | Rating | Rank | Female Poverty Among 18-24 Year Olds |
| Paiute | 0.0 /100 | #306 | Tragic 23.3% |
| Cree | 0.0 /100 | #307 | Tragic 23.4% |
| Immigrants | Sudan | 0.0 /100 | #308 | Tragic 23.5% |
| Blackfeet | 0.0 /100 | #309 | Tragic 23.6% |
| Comanche | 0.0 /100 | #310 | Tragic 23.6% |
| Potawatomi | 0.0 /100 | #311 | Tragic 23.7% |
| Yuman | 0.0 /100 | #312 | Tragic 24.0% |
| Creek | 0.0 /100 | #313 | Tragic 24.2% |
| Choctaw | 0.0 /100 | #314 | Tragic 24.3% |
| Blacks/African Americans | 0.0 /100 | #315 | Tragic 24.3% |
| Alsatians | 0.0 /100 | #316 | Tragic 24.4% |
| Osage | 0.0 /100 | #317 | Tragic 24.5% |
| Chickasaw | 0.0 /100 | #318 | Tragic 24.5% |
| Dutch West Indians | 0.0 /100 | #319 | Tragic 24.5% |
| Immigrants | Congo | 0.0 /100 | #320 | Tragic 24.6% |
Demographics Similar to Immigrants from Eastern Asia by Female Poverty Among 18-24 Year Olds
In terms of female poverty among 18-24 year olds, the demographic groups most similar to Immigrants from Eastern Asia are Syrian (19.8%, a difference of 0.040%), Yugoslavian (19.8%, a difference of 0.050%), Immigrants from Oceania (19.7%, a difference of 0.12%), Immigrants from Japan (19.8%, a difference of 0.12%), and Immigrants from Latin America (19.7%, a difference of 0.13%).
| Demographics | Rating | Rank | Female Poverty Among 18-24 Year Olds |
| Immigrants | Northern Africa | 84.1 /100 | #144 | Excellent 19.7% |
| Canadians | 83.8 /100 | #145 | Excellent 19.7% |
| Immigrants | Bosnia and Herzegovina | 83.6 /100 | #146 | Excellent 19.7% |
| Immigrants | Austria | 83.1 /100 | #147 | Excellent 19.7% |
| Immigrants | Latin America | 81.3 /100 | #148 | Excellent 19.7% |
| Immigrants | Oceania | 81.2 /100 | #149 | Excellent 19.7% |
| Syrians | 80.2 /100 | #150 | Excellent 19.8% |
| Immigrants | Eastern Asia | 79.7 /100 | #151 | Good 19.8% |
| Yugoslavians | 79.0 /100 | #152 | Good 19.8% |
| Immigrants | Japan | 78.1 /100 | #153 | Good 19.8% |
| Immigrants | Zimbabwe | 76.7 /100 | #154 | Good 19.8% |
| Hungarians | 76.6 /100 | #155 | Good 19.8% |
| Immigrants | Belgium | 76.4 /100 | #156 | Good 19.8% |
| Danes | 75.5 /100 | #157 | Good 19.8% |
| Immigrants | Lebanon | 75.3 /100 | #158 | Good 19.8% |