Creek vs Houma Female Poverty Among 18-24 Year Olds
COMPARE
Creek
Houma
Female Poverty Among 18-24 Year Olds
Female Poverty Among 18-24 Year Olds Comparison
Creek
Houma
24.2%
FEMALE POVERTY AMONG 18-24 YEAR OLDS
0.0/ 100
METRIC RATING
313th/ 347
METRIC RANK
26.2%
FEMALE POVERTY AMONG 18-24 YEAR OLDS
0.0/ 100
METRIC RATING
332nd/ 347
METRIC RANK
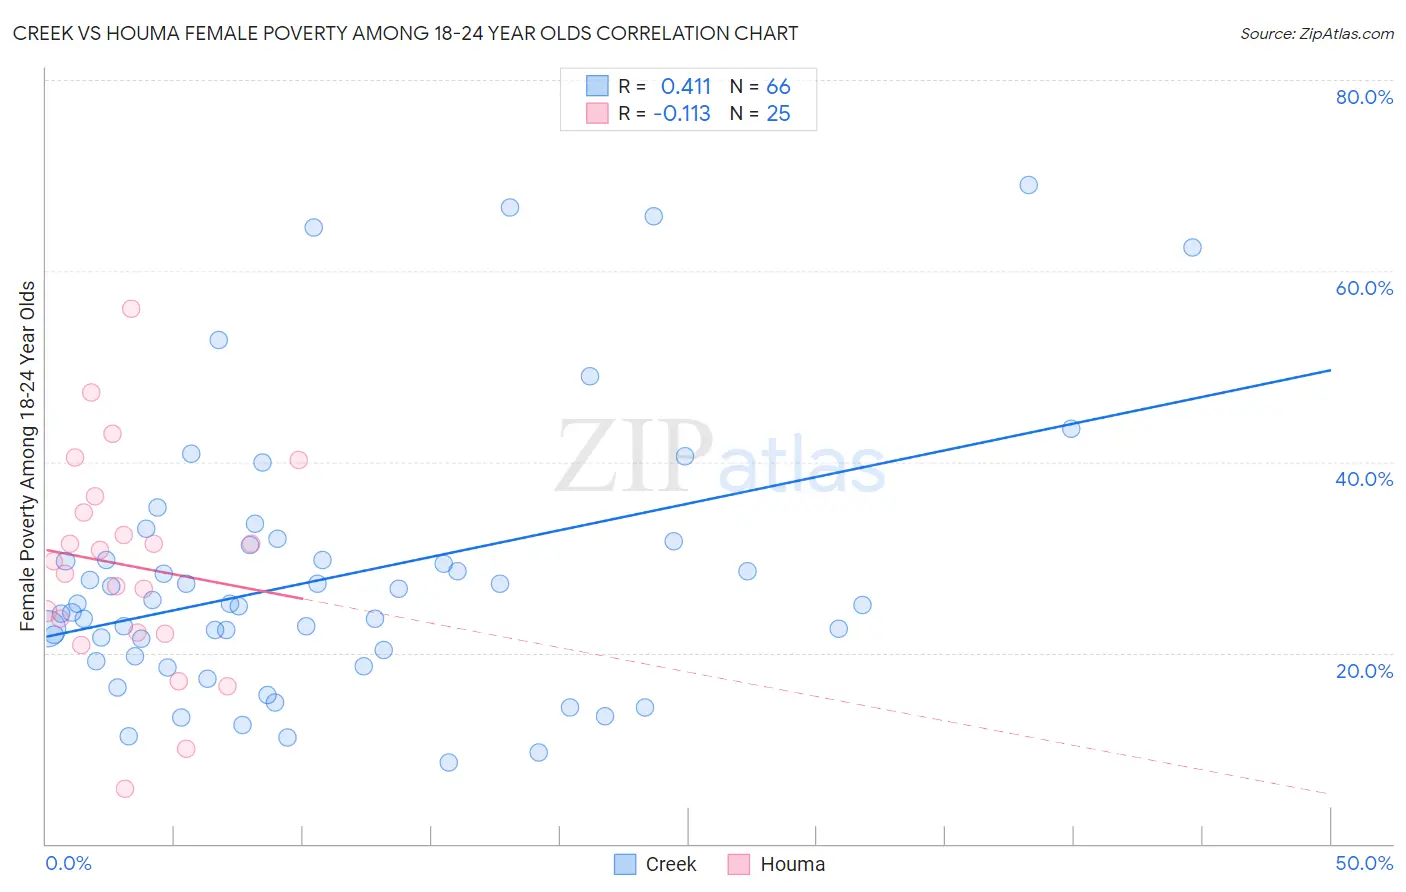
Creek vs Houma Female Poverty Among 18-24 Year Olds Correlation Chart
The statistical analysis conducted on geographies consisting of 176,646,944 people shows a moderate positive correlation between the proportion of Creek and poverty level among females between the ages 18 and 24 in the United States with a correlation coefficient (R) of 0.411 and weighted average of 24.2%. Similarly, the statistical analysis conducted on geographies consisting of 36,618,001 people shows a poor negative correlation between the proportion of Houma and poverty level among females between the ages 18 and 24 in the United States with a correlation coefficient (R) of -0.113 and weighted average of 26.2%, a difference of 8.1%.
Female Poverty Among 18-24 Year Olds Correlation Summary
| Measurement | Creek | Houma |
| Minimum | 8.5% | 5.7% |
| Maximum | 69.0% | 56.0% |
| Range | 60.4% | 50.3% |
| Mean | 28.0% | 29.2% |
| Median | 25.1% | 29.6% |
| Interquartile 25% (IQ1) | 19.7% | 22.1% |
| Interquartile 75% (IQ3) | 31.3% | 35.5% |
| Interquartile Range (IQR) | 11.7% | 13.5% |
| Standard Deviation (Sample) | 14.0% | 11.3% |
| Standard Deviation (Population) | 13.9% | 11.1% |
Demographics Similar to Creek and Houma by Female Poverty Among 18-24 Year Olds
In terms of female poverty among 18-24 year olds, the demographic groups most similar to Creek are Choctaw (24.3%, a difference of 0.16%), Black/African American (24.3%, a difference of 0.36%), Alsatian (24.4%, a difference of 0.67%), Osage (24.5%, a difference of 0.97%), and Chickasaw (24.5%, a difference of 1.1%). Similarly, the demographic groups most similar to Houma are Chippewa (25.9%, a difference of 1.0%), Immigrants from Somalia (25.7%, a difference of 1.7%), Cajun (25.7%, a difference of 1.9%), Native/Alaskan (25.4%, a difference of 3.0%), and Ute (25.4%, a difference of 3.1%).
| Demographics | Rating | Rank | Female Poverty Among 18-24 Year Olds |
| Yuman | 0.0 /100 | #312 | Tragic 24.0% |
| Creek | 0.0 /100 | #313 | Tragic 24.2% |
| Choctaw | 0.0 /100 | #314 | Tragic 24.3% |
| Blacks/African Americans | 0.0 /100 | #315 | Tragic 24.3% |
| Alsatians | 0.0 /100 | #316 | Tragic 24.4% |
| Osage | 0.0 /100 | #317 | Tragic 24.5% |
| Chickasaw | 0.0 /100 | #318 | Tragic 24.5% |
| Dutch West Indians | 0.0 /100 | #319 | Tragic 24.5% |
| Immigrants | Congo | 0.0 /100 | #320 | Tragic 24.6% |
| Immigrants | Zaire | 0.0 /100 | #321 | Tragic 25.1% |
| Somalis | 0.0 /100 | #322 | Tragic 25.1% |
| Arapaho | 0.0 /100 | #323 | Tragic 25.2% |
| German Russians | 0.0 /100 | #324 | Tragic 25.2% |
| Immigrants | Saudi Arabia | 0.0 /100 | #325 | Tragic 25.3% |
| Yakama | 0.0 /100 | #326 | Tragic 25.3% |
| Ute | 0.0 /100 | #327 | Tragic 25.4% |
| Natives/Alaskans | 0.0 /100 | #328 | Tragic 25.4% |
| Cajuns | 0.0 /100 | #329 | Tragic 25.7% |
| Immigrants | Somalia | 0.0 /100 | #330 | Tragic 25.7% |
| Chippewa | 0.0 /100 | #331 | Tragic 25.9% |
| Houma | 0.0 /100 | #332 | Tragic 26.2% |