Estonian vs Immigrants from Cuba Female Poverty
COMPARE
Estonian
Immigrants from Cuba
Female Poverty
Female Poverty Comparison
Estonians
Immigrants from Cuba
12.1%
FEMALE POVERTY
98.3/ 100
METRIC RATING
56th/ 347
METRIC RANK
16.1%
FEMALE POVERTY
0.0/ 100
METRIC RATING
283rd/ 347
METRIC RANK
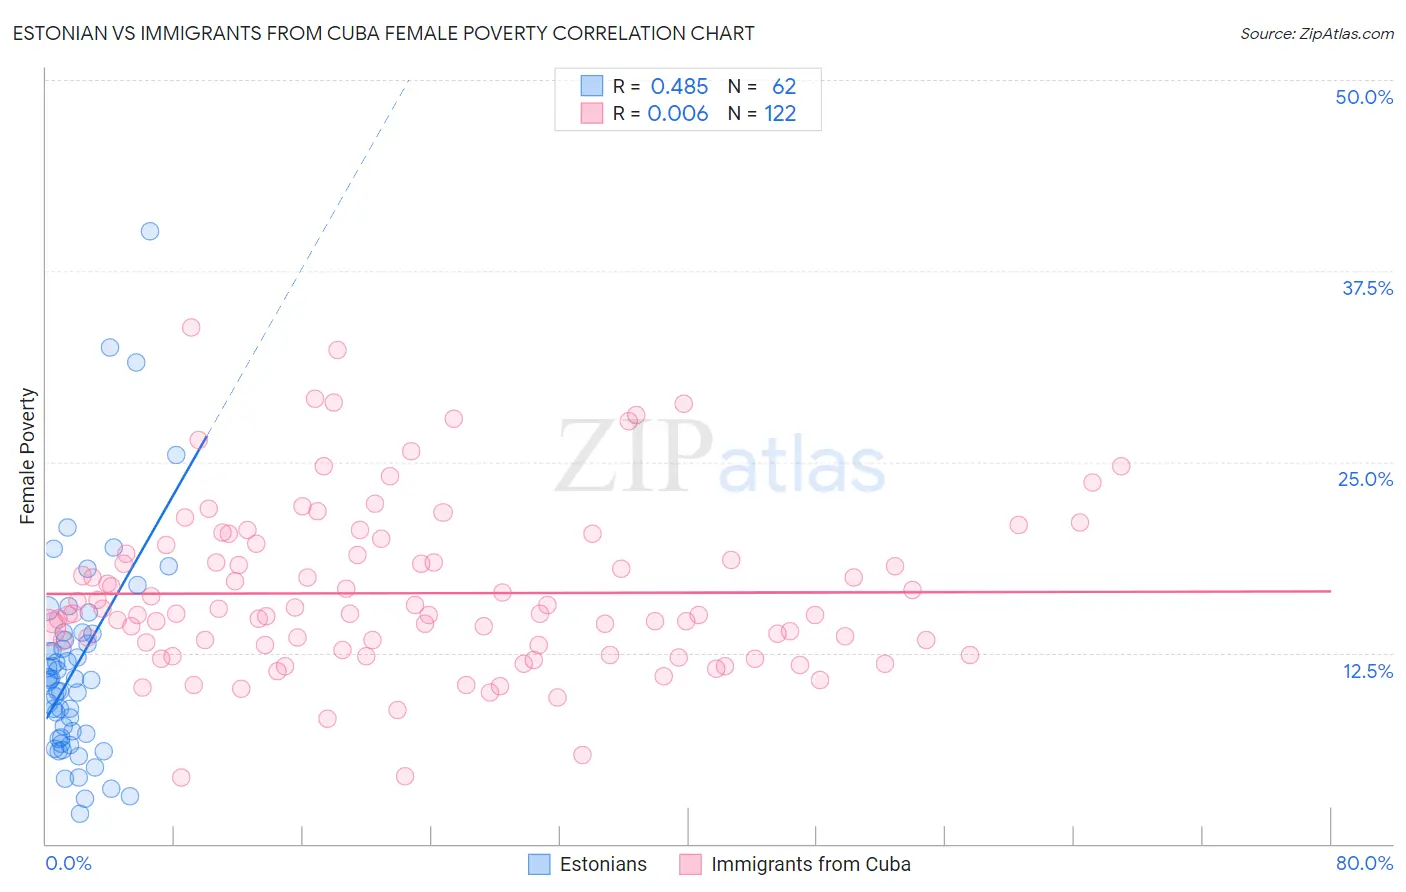
Estonian vs Immigrants from Cuba Female Poverty Correlation Chart
The statistical analysis conducted on geographies consisting of 123,486,564 people shows a moderate positive correlation between the proportion of Estonians and poverty level among females in the United States with a correlation coefficient (R) of 0.485 and weighted average of 12.1%. Similarly, the statistical analysis conducted on geographies consisting of 325,939,480 people shows no correlation between the proportion of Immigrants from Cuba and poverty level among females in the United States with a correlation coefficient (R) of 0.006 and weighted average of 16.1%, a difference of 33.2%.
Female Poverty Correlation Summary
| Measurement | Estonian | Immigrants from Cuba |
| Minimum | 1.9% | 4.3% |
| Maximum | 40.1% | 33.8% |
| Range | 38.2% | 29.5% |
| Mean | 11.7% | 16.4% |
| Median | 10.7% | 15.0% |
| Interquartile 25% (IQ1) | 7.0% | 13.0% |
| Interquartile 75% (IQ3) | 13.8% | 19.0% |
| Interquartile Range (IQR) | 6.8% | 6.0% |
| Standard Deviation (Sample) | 7.1% | 5.5% |
| Standard Deviation (Population) | 7.0% | 5.4% |
Similar Demographics by Female Poverty
Demographics Similar to Estonians by Female Poverty
In terms of female poverty, the demographic groups most similar to Estonians are Immigrants from Serbia (12.1%, a difference of 0.060%), Scandinavian (12.1%, a difference of 0.14%), Immigrants from Europe (12.1%, a difference of 0.15%), Immigrants from Sri Lanka (12.1%, a difference of 0.25%), and Immigrants from Australia (12.2%, a difference of 0.39%).
| Demographics | Rating | Rank | Female Poverty |
| Immigrants | Romania | 99.0 /100 | #49 | Exceptional 12.0% |
| Slovenes | 98.9 /100 | #50 | Exceptional 12.0% |
| Immigrants | Bulgaria | 98.9 /100 | #51 | Exceptional 12.0% |
| Immigrants | Croatia | 98.7 /100 | #52 | Exceptional 12.0% |
| Immigrants | Austria | 98.7 /100 | #53 | Exceptional 12.0% |
| Immigrants | Philippines | 98.7 /100 | #54 | Exceptional 12.1% |
| Immigrants | Sri Lanka | 98.5 /100 | #55 | Exceptional 12.1% |
| Estonians | 98.3 /100 | #56 | Exceptional 12.1% |
| Immigrants | Serbia | 98.3 /100 | #57 | Exceptional 12.1% |
| Scandinavians | 98.2 /100 | #58 | Exceptional 12.1% |
| Immigrants | Europe | 98.2 /100 | #59 | Exceptional 12.1% |
| Immigrants | Australia | 98.1 /100 | #60 | Exceptional 12.2% |
| Immigrants | Asia | 98.1 /100 | #61 | Exceptional 12.2% |
| Immigrants | Italy | 98.0 /100 | #62 | Exceptional 12.2% |
| Ukrainians | 98.0 /100 | #63 | Exceptional 12.2% |
Demographics Similar to Immigrants from Cuba by Female Poverty
In terms of female poverty, the demographic groups most similar to Immigrants from Cuba are Spanish American (16.2%, a difference of 0.050%), Immigrants from Haiti (16.1%, a difference of 0.080%), Comanche (16.2%, a difference of 0.13%), West Indian (16.1%, a difference of 0.24%), and Vietnamese (16.1%, a difference of 0.26%).
| Demographics | Rating | Rank | Female Poverty |
| Central Americans | 0.0 /100 | #276 | Tragic 16.0% |
| Bangladeshis | 0.0 /100 | #277 | Tragic 16.0% |
| Immigrants | West Indies | 0.0 /100 | #278 | Tragic 16.1% |
| Immigrants | Bahamas | 0.0 /100 | #279 | Tragic 16.1% |
| Vietnamese | 0.0 /100 | #280 | Tragic 16.1% |
| West Indians | 0.0 /100 | #281 | Tragic 16.1% |
| Immigrants | Haiti | 0.0 /100 | #282 | Tragic 16.1% |
| Immigrants | Cuba | 0.0 /100 | #283 | Tragic 16.1% |
| Spanish Americans | 0.0 /100 | #284 | Tragic 16.2% |
| Comanche | 0.0 /100 | #285 | Tragic 16.2% |
| Inupiat | 0.0 /100 | #286 | Tragic 16.2% |
| Immigrants | Belize | 0.0 /100 | #287 | Tragic 16.3% |
| Indonesians | 0.0 /100 | #288 | Tragic 16.4% |
| Blackfeet | 0.0 /100 | #289 | Tragic 16.4% |
| Immigrants | Bangladesh | 0.0 /100 | #290 | Tragic 16.4% |