Cree vs Hopi Single Mother Poverty
COMPARE
Cree
Hopi
Single Mother Poverty
Single Mother Poverty Comparison
Cree
Hopi
32.2%
SINGLE MOTHER POVERTY
0.0/ 100
METRIC RATING
281st/ 347
METRIC RANK
34.5%
SINGLE MOTHER POVERTY
0.0/ 100
METRIC RATING
315th/ 347
METRIC RANK
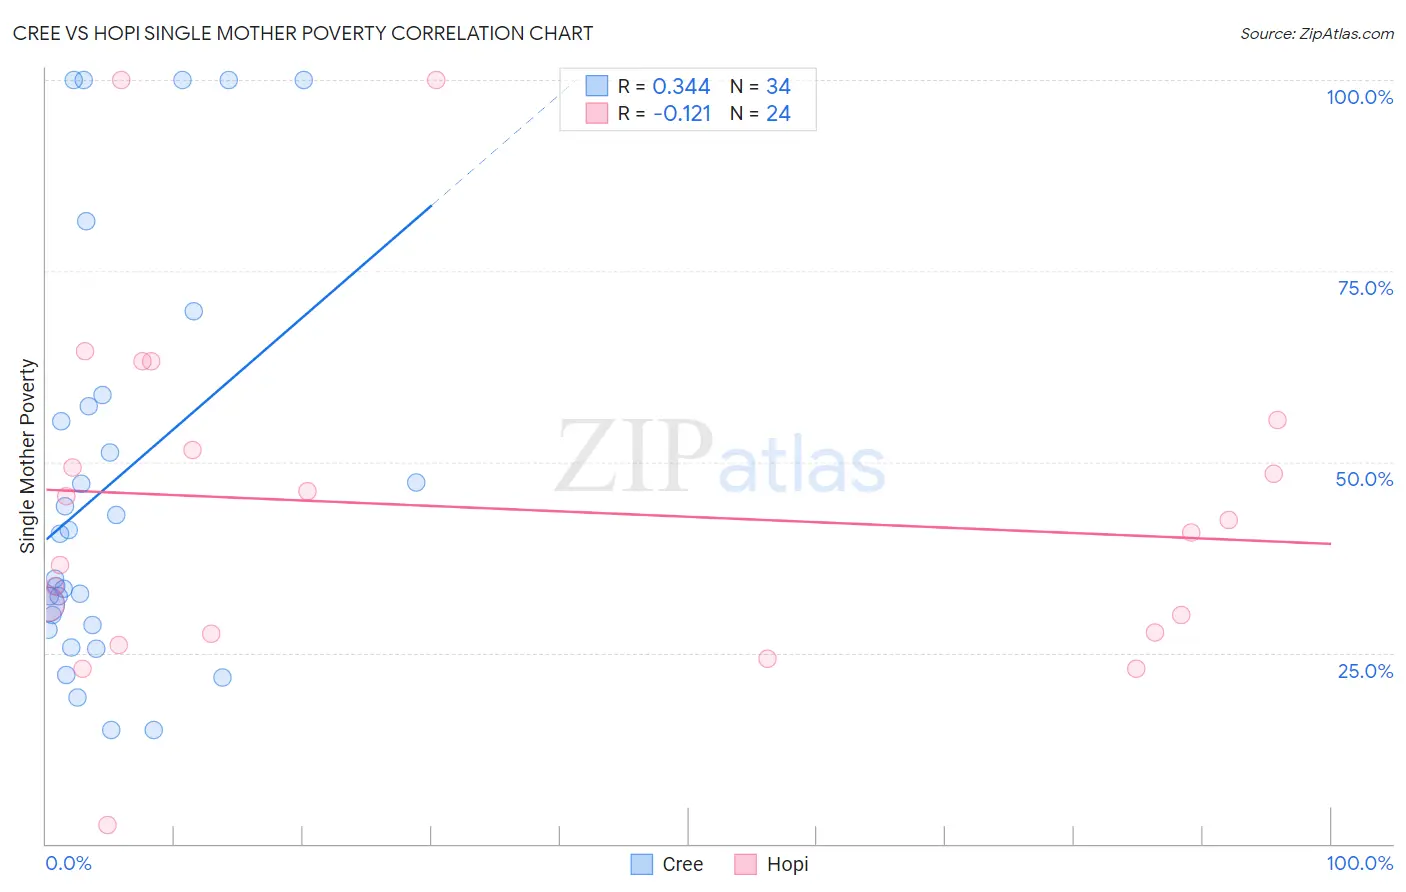
Cree vs Hopi Single Mother Poverty Correlation Chart
The statistical analysis conducted on geographies consisting of 75,775,779 people shows a mild positive correlation between the proportion of Cree and poverty level among single mothers in the United States with a correlation coefficient (R) of 0.344 and weighted average of 32.2%. Similarly, the statistical analysis conducted on geographies consisting of 74,456,192 people shows a poor negative correlation between the proportion of Hopi and poverty level among single mothers in the United States with a correlation coefficient (R) of -0.121 and weighted average of 34.5%, a difference of 7.1%.
Single Mother Poverty Correlation Summary
| Measurement | Cree | Hopi |
| Minimum | 14.9% | 2.5% |
| Maximum | 100.0% | 100.0% |
| Range | 85.1% | 97.5% |
| Mean | 47.0% | 44.0% |
| Median | 37.6% | 41.6% |
| Interquartile 25% (IQ1) | 28.6% | 27.6% |
| Interquartile 75% (IQ3) | 57.4% | 53.5% |
| Interquartile Range (IQR) | 28.8% | 26.0% |
| Standard Deviation (Sample) | 26.7% | 22.9% |
| Standard Deviation (Population) | 26.3% | 22.4% |
Similar Demographics by Single Mother Poverty
Demographics Similar to Cree by Single Mother Poverty
In terms of single mother poverty, the demographic groups most similar to Cree are Nonimmigrants (32.2%, a difference of 0.030%), Immigrants from the Azores (32.2%, a difference of 0.11%), Marshallese (32.1%, a difference of 0.24%), Spanish American (32.3%, a difference of 0.36%), and Immigrants from Zaire (32.0%, a difference of 0.64%).
| Demographics | Rating | Rank | Single Mother Poverty |
| Bangladeshis | 0.1 /100 | #274 | Tragic 31.7% |
| Central Americans | 0.1 /100 | #275 | Tragic 31.8% |
| Delaware | 0.0 /100 | #276 | Tragic 31.8% |
| Mexican American Indians | 0.0 /100 | #277 | Tragic 31.9% |
| Immigrants | Zaire | 0.0 /100 | #278 | Tragic 32.0% |
| Marshallese | 0.0 /100 | #279 | Tragic 32.1% |
| Immigrants | Nonimmigrants | 0.0 /100 | #280 | Tragic 32.2% |
| Cree | 0.0 /100 | #281 | Tragic 32.2% |
| Immigrants | Azores | 0.0 /100 | #282 | Tragic 32.2% |
| Spanish Americans | 0.0 /100 | #283 | Tragic 32.3% |
| Indonesians | 0.0 /100 | #284 | Tragic 32.4% |
| Immigrants | Latin America | 0.0 /100 | #285 | Tragic 32.4% |
| Yup'ik | 0.0 /100 | #286 | Tragic 32.5% |
| Immigrants | Dominica | 0.0 /100 | #287 | Tragic 32.5% |
| Somalis | 0.0 /100 | #288 | Tragic 32.6% |
Demographics Similar to Hopi by Single Mother Poverty
In terms of single mother poverty, the demographic groups most similar to Hopi are Chickasaw (34.4%, a difference of 0.080%), Dominican (34.5%, a difference of 0.12%), Cherokee (34.5%, a difference of 0.22%), Immigrants from Dominican Republic (34.4%, a difference of 0.25%), and Central American Indian (34.3%, a difference of 0.34%).
| Demographics | Rating | Rank | Single Mother Poverty |
| Immigrants | Mexico | 0.0 /100 | #308 | Tragic 34.0% |
| Potawatomi | 0.0 /100 | #309 | Tragic 34.1% |
| Hondurans | 0.0 /100 | #310 | Tragic 34.2% |
| Alsatians | 0.0 /100 | #311 | Tragic 34.3% |
| Central American Indians | 0.0 /100 | #312 | Tragic 34.3% |
| Immigrants | Dominican Republic | 0.0 /100 | #313 | Tragic 34.4% |
| Chickasaw | 0.0 /100 | #314 | Tragic 34.4% |
| Hopi | 0.0 /100 | #315 | Tragic 34.5% |
| Dominicans | 0.0 /100 | #316 | Tragic 34.5% |
| Cherokee | 0.0 /100 | #317 | Tragic 34.5% |
| Immigrants | Honduras | 0.0 /100 | #318 | Tragic 34.7% |
| Chippewa | 0.0 /100 | #319 | Tragic 34.8% |
| Iroquois | 0.0 /100 | #320 | Tragic 34.8% |
| Paiute | 0.0 /100 | #321 | Tragic 35.1% |
| Blacks/African Americans | 0.0 /100 | #322 | Tragic 35.2% |