Cree vs Finnish Single Mother Poverty
COMPARE
Cree
Finnish
Single Mother Poverty
Single Mother Poverty Comparison
Cree
Finns
32.2%
SINGLE MOTHER POVERTY
0.0/ 100
METRIC RATING
281st/ 347
METRIC RANK
30.0%
SINGLE MOTHER POVERTY
9.3/ 100
METRIC RATING
219th/ 347
METRIC RANK
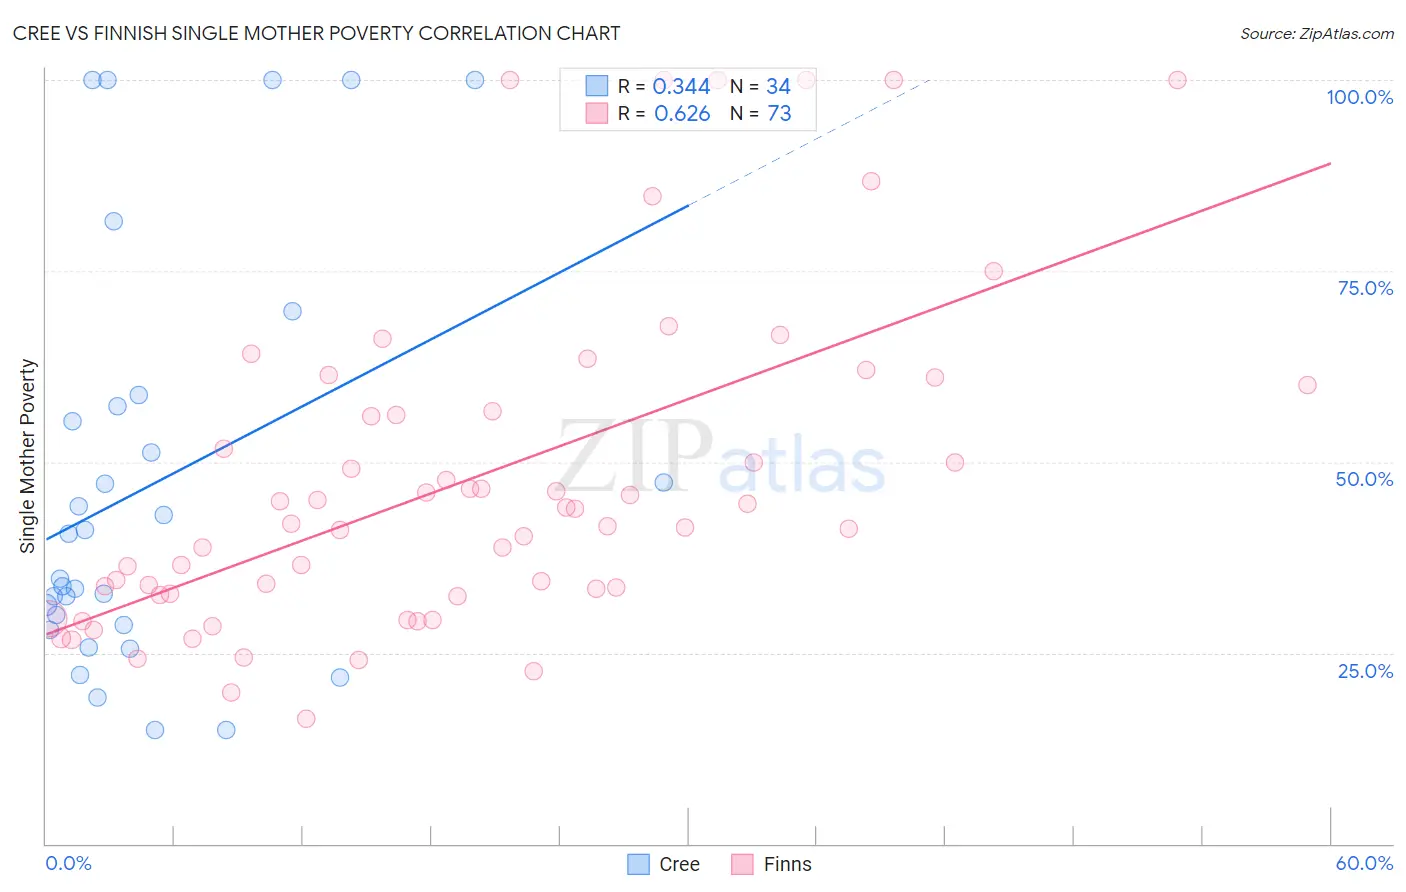
Cree vs Finnish Single Mother Poverty Correlation Chart
The statistical analysis conducted on geographies consisting of 75,775,779 people shows a mild positive correlation between the proportion of Cree and poverty level among single mothers in the United States with a correlation coefficient (R) of 0.344 and weighted average of 32.2%. Similarly, the statistical analysis conducted on geographies consisting of 392,432,308 people shows a significant positive correlation between the proportion of Finns and poverty level among single mothers in the United States with a correlation coefficient (R) of 0.626 and weighted average of 30.0%, a difference of 7.4%.
Single Mother Poverty Correlation Summary
| Measurement | Cree | Finnish |
| Minimum | 14.9% | 16.4% |
| Maximum | 100.0% | 100.0% |
| Range | 85.1% | 83.6% |
| Mean | 47.0% | 47.6% |
| Median | 37.6% | 42.0% |
| Interquartile 25% (IQ1) | 28.6% | 32.7% |
| Interquartile 75% (IQ3) | 57.4% | 58.3% |
| Interquartile Range (IQR) | 28.8% | 25.6% |
| Standard Deviation (Sample) | 26.7% | 21.5% |
| Standard Deviation (Population) | 26.3% | 21.4% |
Similar Demographics by Single Mother Poverty
Demographics Similar to Cree by Single Mother Poverty
In terms of single mother poverty, the demographic groups most similar to Cree are Nonimmigrants (32.2%, a difference of 0.030%), Immigrants from the Azores (32.2%, a difference of 0.11%), Marshallese (32.1%, a difference of 0.24%), Spanish American (32.3%, a difference of 0.36%), and Immigrants from Zaire (32.0%, a difference of 0.64%).
| Demographics | Rating | Rank | Single Mother Poverty |
| Bangladeshis | 0.1 /100 | #274 | Tragic 31.7% |
| Central Americans | 0.1 /100 | #275 | Tragic 31.8% |
| Delaware | 0.0 /100 | #276 | Tragic 31.8% |
| Mexican American Indians | 0.0 /100 | #277 | Tragic 31.9% |
| Immigrants | Zaire | 0.0 /100 | #278 | Tragic 32.0% |
| Marshallese | 0.0 /100 | #279 | Tragic 32.1% |
| Immigrants | Nonimmigrants | 0.0 /100 | #280 | Tragic 32.2% |
| Cree | 0.0 /100 | #281 | Tragic 32.2% |
| Immigrants | Azores | 0.0 /100 | #282 | Tragic 32.2% |
| Spanish Americans | 0.0 /100 | #283 | Tragic 32.3% |
| Indonesians | 0.0 /100 | #284 | Tragic 32.4% |
| Immigrants | Latin America | 0.0 /100 | #285 | Tragic 32.4% |
| Yup'ik | 0.0 /100 | #286 | Tragic 32.5% |
| Immigrants | Dominica | 0.0 /100 | #287 | Tragic 32.5% |
| Somalis | 0.0 /100 | #288 | Tragic 32.6% |
Demographics Similar to Finns by Single Mother Poverty
In terms of single mother poverty, the demographic groups most similar to Finns are German (30.0%, a difference of 0.070%), Hungarian (29.9%, a difference of 0.14%), Immigrants from Ghana (29.9%, a difference of 0.25%), Immigrants from Eritrea (30.0%, a difference of 0.25%), and Sudanese (30.0%, a difference of 0.25%).
| Demographics | Rating | Rank | Single Mother Poverty |
| Nicaraguans | 12.4 /100 | #212 | Poor 29.8% |
| Immigrants | Thailand | 12.0 /100 | #213 | Poor 29.9% |
| Liberians | 11.7 /100 | #214 | Poor 29.9% |
| Jamaicans | 11.7 /100 | #215 | Poor 29.9% |
| Immigrants | Western Africa | 11.5 /100 | #216 | Poor 29.9% |
| Immigrants | Ghana | 11.3 /100 | #217 | Poor 29.9% |
| Hungarians | 10.3 /100 | #218 | Poor 29.9% |
| Finns | 9.3 /100 | #219 | Tragic 30.0% |
| Germans | 8.8 /100 | #220 | Tragic 30.0% |
| Immigrants | Eritrea | 7.7 /100 | #221 | Tragic 30.0% |
| Sudanese | 7.6 /100 | #222 | Tragic 30.0% |
| Immigrants | Cuba | 6.9 /100 | #223 | Tragic 30.1% |
| Immigrants | Sudan | 6.5 /100 | #224 | Tragic 30.1% |
| Spanish | 6.3 /100 | #225 | Tragic 30.1% |
| Scottish | 6.0 /100 | #226 | Tragic 30.1% |