Cree vs Sierra Leonean Single Mother Poverty
COMPARE
Cree
Sierra Leonean
Single Mother Poverty
Single Mother Poverty Comparison
Cree
Sierra Leoneans
32.2%
SINGLE MOTHER POVERTY
0.0/ 100
METRIC RATING
281st/ 347
METRIC RANK
27.4%
SINGLE MOTHER POVERTY
99.3/ 100
METRIC RATING
73rd/ 347
METRIC RANK
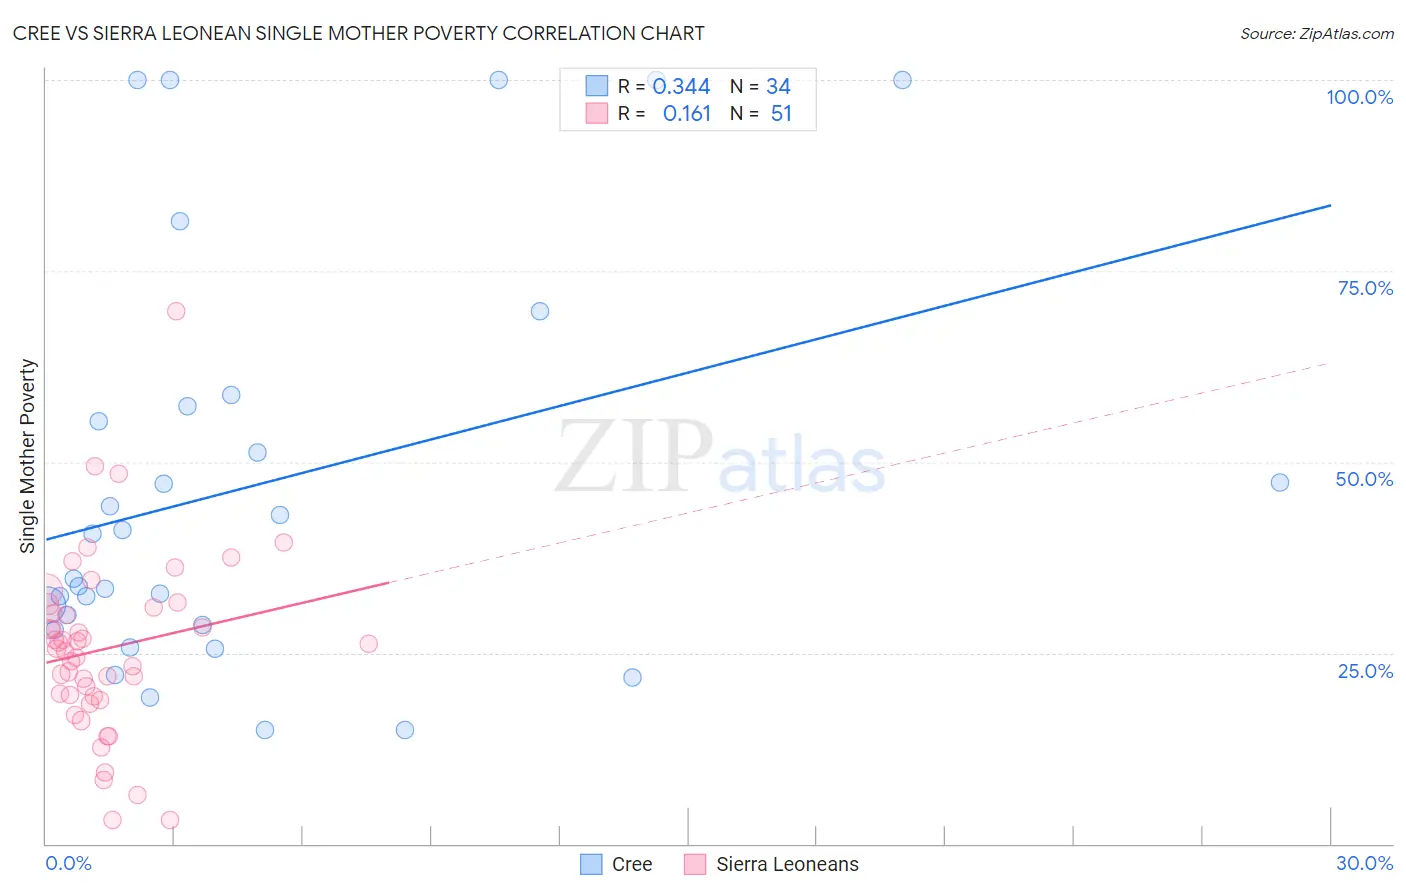
Cree vs Sierra Leonean Single Mother Poverty Correlation Chart
The statistical analysis conducted on geographies consisting of 75,775,779 people shows a mild positive correlation between the proportion of Cree and poverty level among single mothers in the United States with a correlation coefficient (R) of 0.344 and weighted average of 32.2%. Similarly, the statistical analysis conducted on geographies consisting of 83,072,166 people shows a poor positive correlation between the proportion of Sierra Leoneans and poverty level among single mothers in the United States with a correlation coefficient (R) of 0.161 and weighted average of 27.4%, a difference of 17.3%.
Single Mother Poverty Correlation Summary
| Measurement | Cree | Sierra Leonean |
| Minimum | 14.9% | 3.1% |
| Maximum | 100.0% | 69.8% |
| Range | 85.1% | 66.7% |
| Mean | 47.0% | 25.5% |
| Median | 37.6% | 25.6% |
| Interquartile 25% (IQ1) | 28.6% | 19.4% |
| Interquartile 75% (IQ3) | 57.4% | 31.0% |
| Interquartile Range (IQR) | 28.8% | 11.6% |
| Standard Deviation (Sample) | 26.7% | 11.8% |
| Standard Deviation (Population) | 26.3% | 11.7% |
Similar Demographics by Single Mother Poverty
Demographics Similar to Cree by Single Mother Poverty
In terms of single mother poverty, the demographic groups most similar to Cree are Nonimmigrants (32.2%, a difference of 0.030%), Immigrants from the Azores (32.2%, a difference of 0.11%), Marshallese (32.1%, a difference of 0.24%), Spanish American (32.3%, a difference of 0.36%), and Immigrants from Zaire (32.0%, a difference of 0.64%).
| Demographics | Rating | Rank | Single Mother Poverty |
| Bangladeshis | 0.1 /100 | #274 | Tragic 31.7% |
| Central Americans | 0.1 /100 | #275 | Tragic 31.8% |
| Delaware | 0.0 /100 | #276 | Tragic 31.8% |
| Mexican American Indians | 0.0 /100 | #277 | Tragic 31.9% |
| Immigrants | Zaire | 0.0 /100 | #278 | Tragic 32.0% |
| Marshallese | 0.0 /100 | #279 | Tragic 32.1% |
| Immigrants | Nonimmigrants | 0.0 /100 | #280 | Tragic 32.2% |
| Cree | 0.0 /100 | #281 | Tragic 32.2% |
| Immigrants | Azores | 0.0 /100 | #282 | Tragic 32.2% |
| Spanish Americans | 0.0 /100 | #283 | Tragic 32.3% |
| Indonesians | 0.0 /100 | #284 | Tragic 32.4% |
| Immigrants | Latin America | 0.0 /100 | #285 | Tragic 32.4% |
| Yup'ik | 0.0 /100 | #286 | Tragic 32.5% |
| Immigrants | Dominica | 0.0 /100 | #287 | Tragic 32.5% |
| Somalis | 0.0 /100 | #288 | Tragic 32.6% |
Demographics Similar to Sierra Leoneans by Single Mother Poverty
In terms of single mother poverty, the demographic groups most similar to Sierra Leoneans are Immigrants from Russia (27.4%, a difference of 0.060%), Immigrants from Europe (27.4%, a difference of 0.060%), Macedonian (27.4%, a difference of 0.090%), Immigrants from Belarus (27.4%, a difference of 0.11%), and Lithuanian (27.4%, a difference of 0.12%).
| Demographics | Rating | Rank | Single Mother Poverty |
| Soviet Union | 99.5 /100 | #66 | Exceptional 27.3% |
| Immigrants | Australia | 99.5 /100 | #67 | Exceptional 27.3% |
| Immigrants | Czechoslovakia | 99.5 /100 | #68 | Exceptional 27.4% |
| Lithuanians | 99.4 /100 | #69 | Exceptional 27.4% |
| Immigrants | Belarus | 99.4 /100 | #70 | Exceptional 27.4% |
| Macedonians | 99.4 /100 | #71 | Exceptional 27.4% |
| Immigrants | Russia | 99.4 /100 | #72 | Exceptional 27.4% |
| Sierra Leoneans | 99.3 /100 | #73 | Exceptional 27.4% |
| Immigrants | Europe | 99.3 /100 | #74 | Exceptional 27.4% |
| Immigrants | Sweden | 99.2 /100 | #75 | Exceptional 27.5% |
| Peruvians | 99.2 /100 | #76 | Exceptional 27.5% |
| Immigrants | Peru | 99.2 /100 | #77 | Exceptional 27.5% |
| Immigrants | North Macedonia | 99.2 /100 | #78 | Exceptional 27.5% |
| Immigrants | Italy | 99.1 /100 | #79 | Exceptional 27.5% |
| Taiwanese | 99.1 /100 | #80 | Exceptional 27.5% |