Austrian vs Hopi Single Mother Poverty
COMPARE
Austrian
Hopi
Single Mother Poverty
Single Mother Poverty Comparison
Austrians
Hopi
28.7%
SINGLE MOTHER POVERTY
79.0/ 100
METRIC RATING
152nd/ 347
METRIC RANK
34.5%
SINGLE MOTHER POVERTY
0.0/ 100
METRIC RATING
315th/ 347
METRIC RANK
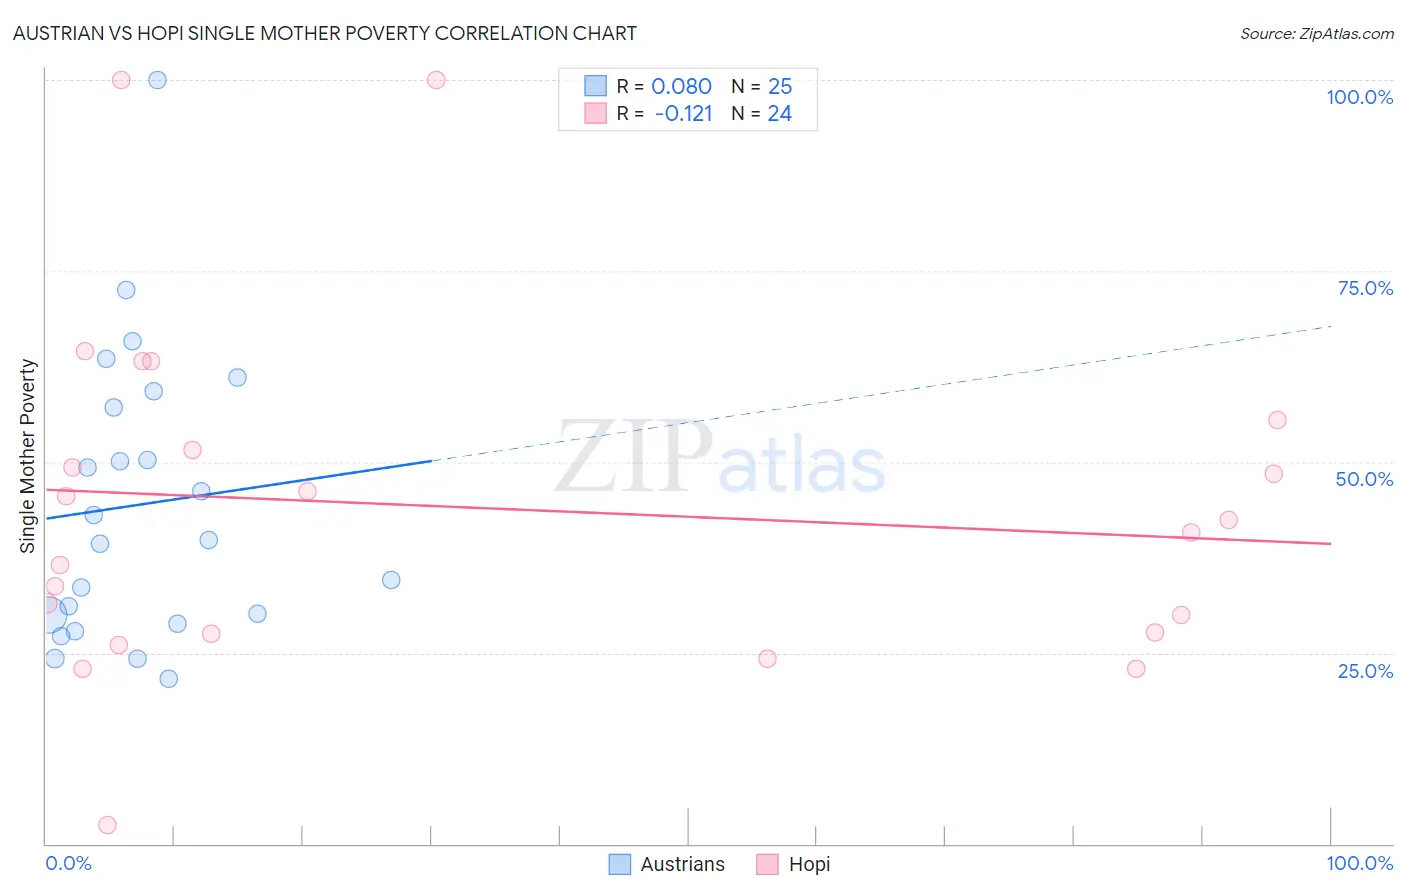
Austrian vs Hopi Single Mother Poverty Correlation Chart
The statistical analysis conducted on geographies consisting of 435,772,358 people shows a slight positive correlation between the proportion of Austrians and poverty level among single mothers in the United States with a correlation coefficient (R) of 0.080 and weighted average of 28.7%. Similarly, the statistical analysis conducted on geographies consisting of 74,456,192 people shows a poor negative correlation between the proportion of Hopi and poverty level among single mothers in the United States with a correlation coefficient (R) of -0.121 and weighted average of 34.5%, a difference of 20.0%.
Single Mother Poverty Correlation Summary
| Measurement | Austrian | Hopi |
| Minimum | 21.6% | 2.5% |
| Maximum | 100.0% | 100.0% |
| Range | 78.4% | 97.5% |
| Mean | 44.4% | 44.0% |
| Median | 39.8% | 41.6% |
| Interquartile 25% (IQ1) | 29.3% | 27.6% |
| Interquartile 75% (IQ3) | 58.2% | 53.5% |
| Interquartile Range (IQR) | 28.8% | 26.0% |
| Standard Deviation (Sample) | 18.8% | 22.9% |
| Standard Deviation (Population) | 18.4% | 22.4% |
Similar Demographics by Single Mother Poverty
Demographics Similar to Austrians by Single Mother Poverty
In terms of single mother poverty, the demographic groups most similar to Austrians are Immigrants from Oceania (28.7%, a difference of 0.070%), Slovene (28.8%, a difference of 0.18%), Northern European (28.6%, a difference of 0.21%), Portuguese (28.8%, a difference of 0.39%), and Ugandan (28.8%, a difference of 0.47%).
| Demographics | Rating | Rank | Single Mother Poverty |
| Immigrants | South America | 86.1 /100 | #145 | Excellent 28.5% |
| Immigrants | Denmark | 86.1 /100 | #146 | Excellent 28.5% |
| Immigrants | Lebanon | 85.3 /100 | #147 | Excellent 28.6% |
| Syrians | 85.3 /100 | #148 | Excellent 28.6% |
| Serbians | 85.0 /100 | #149 | Excellent 28.6% |
| Northern Europeans | 81.7 /100 | #150 | Excellent 28.6% |
| Immigrants | Oceania | 79.9 /100 | #151 | Good 28.7% |
| Austrians | 79.0 /100 | #152 | Good 28.7% |
| Slovenes | 76.4 /100 | #153 | Good 28.8% |
| Portuguese | 73.2 /100 | #154 | Good 28.8% |
| Ugandans | 71.7 /100 | #155 | Good 28.8% |
| Iraqis | 71.5 /100 | #156 | Good 28.8% |
| Immigrants | Western Europe | 71.1 /100 | #157 | Good 28.9% |
| Immigrants | Hungary | 70.6 /100 | #158 | Good 28.9% |
| Czechs | 68.4 /100 | #159 | Good 28.9% |
Demographics Similar to Hopi by Single Mother Poverty
In terms of single mother poverty, the demographic groups most similar to Hopi are Chickasaw (34.4%, a difference of 0.080%), Dominican (34.5%, a difference of 0.12%), Cherokee (34.5%, a difference of 0.22%), Immigrants from Dominican Republic (34.4%, a difference of 0.25%), and Central American Indian (34.3%, a difference of 0.34%).
| Demographics | Rating | Rank | Single Mother Poverty |
| Immigrants | Mexico | 0.0 /100 | #308 | Tragic 34.0% |
| Potawatomi | 0.0 /100 | #309 | Tragic 34.1% |
| Hondurans | 0.0 /100 | #310 | Tragic 34.2% |
| Alsatians | 0.0 /100 | #311 | Tragic 34.3% |
| Central American Indians | 0.0 /100 | #312 | Tragic 34.3% |
| Immigrants | Dominican Republic | 0.0 /100 | #313 | Tragic 34.4% |
| Chickasaw | 0.0 /100 | #314 | Tragic 34.4% |
| Hopi | 0.0 /100 | #315 | Tragic 34.5% |
| Dominicans | 0.0 /100 | #316 | Tragic 34.5% |
| Cherokee | 0.0 /100 | #317 | Tragic 34.5% |
| Immigrants | Honduras | 0.0 /100 | #318 | Tragic 34.7% |
| Chippewa | 0.0 /100 | #319 | Tragic 34.8% |
| Iroquois | 0.0 /100 | #320 | Tragic 34.8% |
| Paiute | 0.0 /100 | #321 | Tragic 35.1% |
| Blacks/African Americans | 0.0 /100 | #322 | Tragic 35.2% |