Cree vs Immigrants from Kazakhstan Single Mother Poverty
COMPARE
Cree
Immigrants from Kazakhstan
Single Mother Poverty
Single Mother Poverty Comparison
Cree
Immigrants from Kazakhstan
32.2%
SINGLE MOTHER POVERTY
0.0/ 100
METRIC RATING
281st/ 347
METRIC RANK
28.2%
SINGLE MOTHER POVERTY
94.5/ 100
METRIC RATING
112th/ 347
METRIC RANK
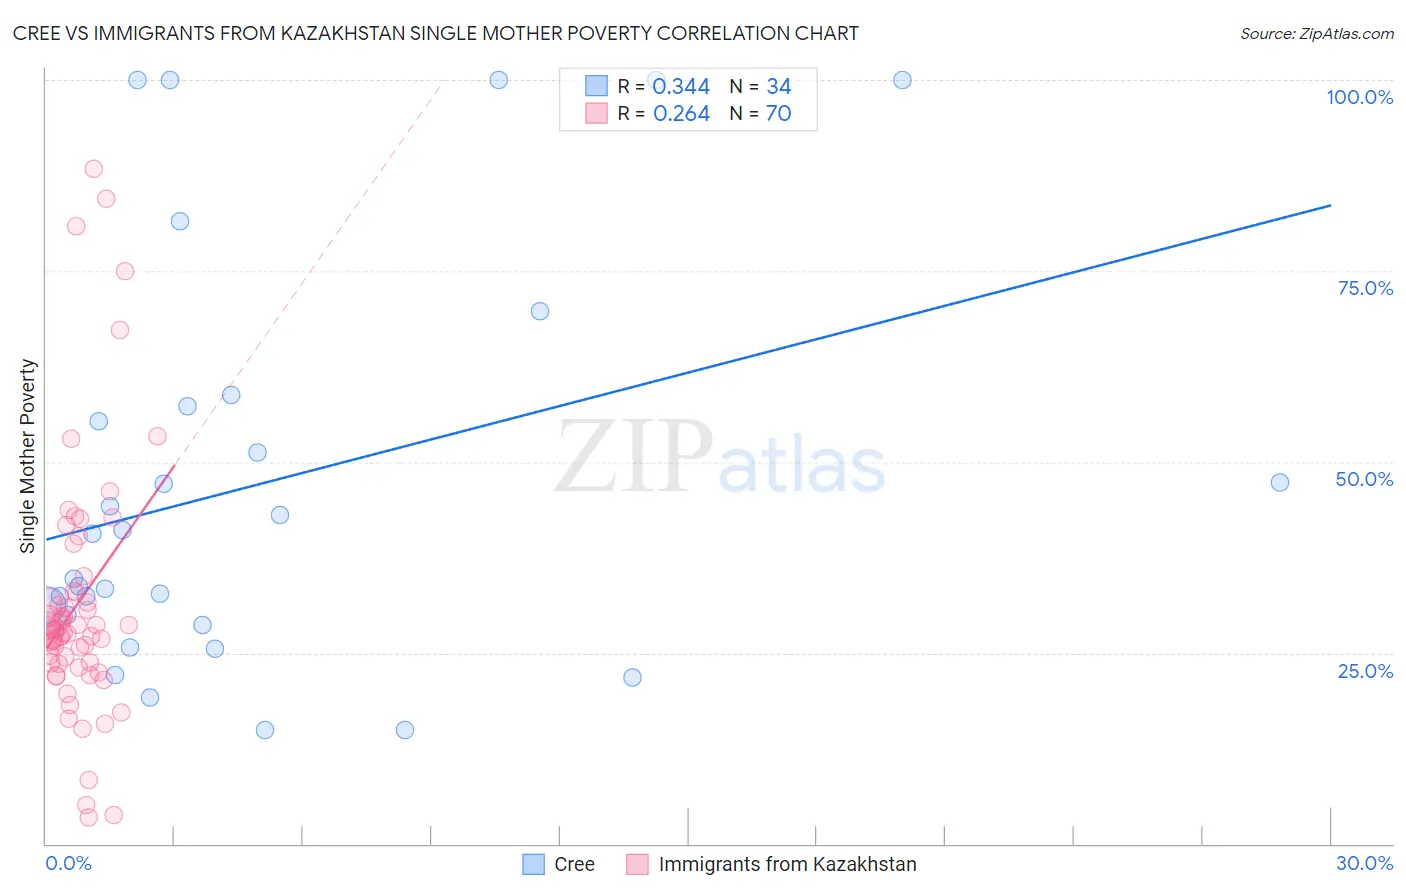
Cree vs Immigrants from Kazakhstan Single Mother Poverty Correlation Chart
The statistical analysis conducted on geographies consisting of 75,775,779 people shows a mild positive correlation between the proportion of Cree and poverty level among single mothers in the United States with a correlation coefficient (R) of 0.344 and weighted average of 32.2%. Similarly, the statistical analysis conducted on geographies consisting of 123,126,284 people shows a weak positive correlation between the proportion of Immigrants from Kazakhstan and poverty level among single mothers in the United States with a correlation coefficient (R) of 0.264 and weighted average of 28.2%, a difference of 14.2%.
Single Mother Poverty Correlation Summary
| Measurement | Cree | Immigrants from Kazakhstan |
| Minimum | 14.9% | 3.4% |
| Maximum | 100.0% | 88.4% |
| Range | 85.1% | 85.0% |
| Mean | 47.0% | 31.4% |
| Median | 37.6% | 27.9% |
| Interquartile 25% (IQ1) | 28.6% | 23.7% |
| Interquartile 75% (IQ3) | 57.4% | 32.9% |
| Interquartile Range (IQR) | 28.8% | 9.2% |
| Standard Deviation (Sample) | 26.7% | 16.5% |
| Standard Deviation (Population) | 26.3% | 16.4% |
Similar Demographics by Single Mother Poverty
Demographics Similar to Cree by Single Mother Poverty
In terms of single mother poverty, the demographic groups most similar to Cree are Nonimmigrants (32.2%, a difference of 0.030%), Immigrants from the Azores (32.2%, a difference of 0.11%), Marshallese (32.1%, a difference of 0.24%), Spanish American (32.3%, a difference of 0.36%), and Immigrants from Zaire (32.0%, a difference of 0.64%).
| Demographics | Rating | Rank | Single Mother Poverty |
| Bangladeshis | 0.1 /100 | #274 | Tragic 31.7% |
| Central Americans | 0.1 /100 | #275 | Tragic 31.8% |
| Delaware | 0.0 /100 | #276 | Tragic 31.8% |
| Mexican American Indians | 0.0 /100 | #277 | Tragic 31.9% |
| Immigrants | Zaire | 0.0 /100 | #278 | Tragic 32.0% |
| Marshallese | 0.0 /100 | #279 | Tragic 32.1% |
| Immigrants | Nonimmigrants | 0.0 /100 | #280 | Tragic 32.2% |
| Cree | 0.0 /100 | #281 | Tragic 32.2% |
| Immigrants | Azores | 0.0 /100 | #282 | Tragic 32.2% |
| Spanish Americans | 0.0 /100 | #283 | Tragic 32.3% |
| Indonesians | 0.0 /100 | #284 | Tragic 32.4% |
| Immigrants | Latin America | 0.0 /100 | #285 | Tragic 32.4% |
| Yup'ik | 0.0 /100 | #286 | Tragic 32.5% |
| Immigrants | Dominica | 0.0 /100 | #287 | Tragic 32.5% |
| Somalis | 0.0 /100 | #288 | Tragic 32.6% |
Demographics Similar to Immigrants from Kazakhstan by Single Mother Poverty
In terms of single mother poverty, the demographic groups most similar to Immigrants from Kazakhstan are Venezuelan (28.2%, a difference of 0.010%), Croatian (28.2%, a difference of 0.060%), Immigrants from Armenia (28.1%, a difference of 0.19%), Immigrants from Zimbabwe (28.1%, a difference of 0.28%), and Immigrants from South Africa (28.3%, a difference of 0.28%).
| Demographics | Rating | Rank | Single Mother Poverty |
| Israelis | 96.5 /100 | #105 | Exceptional 28.0% |
| Ukrainians | 96.4 /100 | #106 | Exceptional 28.0% |
| Immigrants | Venezuela | 95.8 /100 | #107 | Exceptional 28.1% |
| Immigrants | Zimbabwe | 95.5 /100 | #108 | Exceptional 28.1% |
| Immigrants | Armenia | 95.2 /100 | #109 | Exceptional 28.1% |
| Croatians | 94.8 /100 | #110 | Exceptional 28.2% |
| Venezuelans | 94.5 /100 | #111 | Exceptional 28.2% |
| Immigrants | Kazakhstan | 94.5 /100 | #112 | Exceptional 28.2% |
| Immigrants | South Africa | 93.2 /100 | #113 | Exceptional 28.3% |
| Immigrants | Western Asia | 92.7 /100 | #114 | Exceptional 28.3% |
| Immigrants | Kuwait | 92.7 /100 | #115 | Exceptional 28.3% |
| Immigrants | Uganda | 92.5 /100 | #116 | Exceptional 28.3% |
| Australians | 92.5 /100 | #117 | Exceptional 28.3% |
| Brazilians | 92.4 /100 | #118 | Exceptional 28.3% |
| Immigrants | Syria | 92.4 /100 | #119 | Exceptional 28.3% |