Cree vs Immigrants from Albania Single Mother Poverty
COMPARE
Cree
Immigrants from Albania
Single Mother Poverty
Single Mother Poverty Comparison
Cree
Immigrants from Albania
32.2%
SINGLE MOTHER POVERTY
0.0/ 100
METRIC RATING
281st/ 347
METRIC RANK
27.8%
SINGLE MOTHER POVERTY
98.0/ 100
METRIC RATING
91st/ 347
METRIC RANK
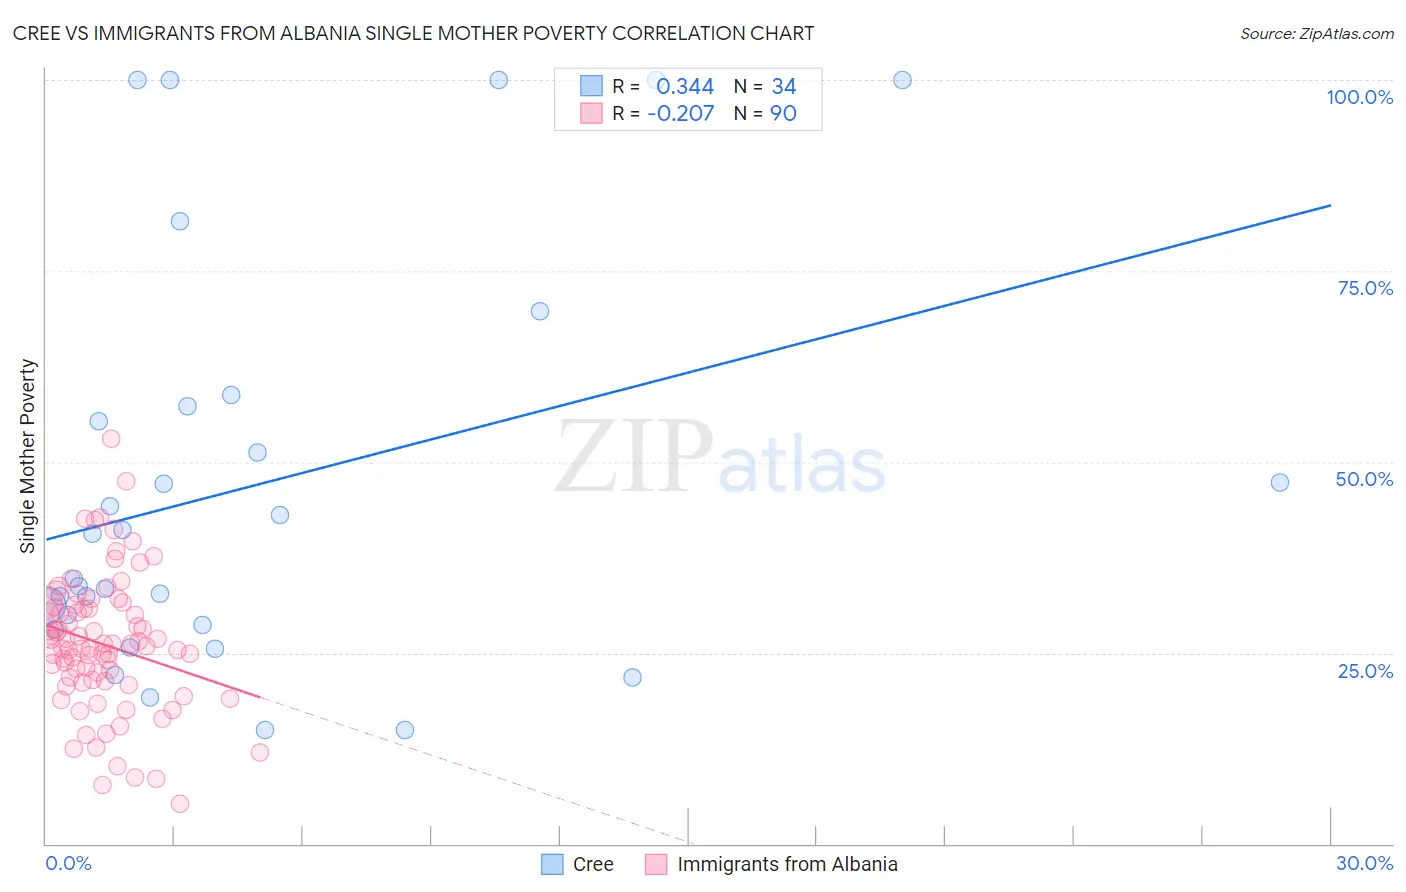
Cree vs Immigrants from Albania Single Mother Poverty Correlation Chart
The statistical analysis conducted on geographies consisting of 75,775,779 people shows a mild positive correlation between the proportion of Cree and poverty level among single mothers in the United States with a correlation coefficient (R) of 0.344 and weighted average of 32.2%. Similarly, the statistical analysis conducted on geographies consisting of 117,790,749 people shows a weak negative correlation between the proportion of Immigrants from Albania and poverty level among single mothers in the United States with a correlation coefficient (R) of -0.207 and weighted average of 27.8%, a difference of 15.7%.
Single Mother Poverty Correlation Summary
| Measurement | Cree | Immigrants from Albania |
| Minimum | 14.9% | 5.2% |
| Maximum | 100.0% | 53.0% |
| Range | 85.1% | 47.8% |
| Mean | 47.0% | 26.1% |
| Median | 37.6% | 26.0% |
| Interquartile 25% (IQ1) | 28.6% | 21.3% |
| Interquartile 75% (IQ3) | 57.4% | 31.0% |
| Interquartile Range (IQR) | 28.8% | 9.7% |
| Standard Deviation (Sample) | 26.7% | 8.8% |
| Standard Deviation (Population) | 26.3% | 8.8% |
Similar Demographics by Single Mother Poverty
Demographics Similar to Cree by Single Mother Poverty
In terms of single mother poverty, the demographic groups most similar to Cree are Nonimmigrants (32.2%, a difference of 0.030%), Immigrants from the Azores (32.2%, a difference of 0.11%), Marshallese (32.1%, a difference of 0.24%), Spanish American (32.3%, a difference of 0.36%), and Immigrants from Zaire (32.0%, a difference of 0.64%).
| Demographics | Rating | Rank | Single Mother Poverty |
| Bangladeshis | 0.1 /100 | #274 | Tragic 31.7% |
| Central Americans | 0.1 /100 | #275 | Tragic 31.8% |
| Delaware | 0.0 /100 | #276 | Tragic 31.8% |
| Mexican American Indians | 0.0 /100 | #277 | Tragic 31.9% |
| Immigrants | Zaire | 0.0 /100 | #278 | Tragic 32.0% |
| Marshallese | 0.0 /100 | #279 | Tragic 32.1% |
| Immigrants | Nonimmigrants | 0.0 /100 | #280 | Tragic 32.2% |
| Cree | 0.0 /100 | #281 | Tragic 32.2% |
| Immigrants | Azores | 0.0 /100 | #282 | Tragic 32.2% |
| Spanish Americans | 0.0 /100 | #283 | Tragic 32.3% |
| Indonesians | 0.0 /100 | #284 | Tragic 32.4% |
| Immigrants | Latin America | 0.0 /100 | #285 | Tragic 32.4% |
| Yup'ik | 0.0 /100 | #286 | Tragic 32.5% |
| Immigrants | Dominica | 0.0 /100 | #287 | Tragic 32.5% |
| Somalis | 0.0 /100 | #288 | Tragic 32.6% |
Demographics Similar to Immigrants from Albania by Single Mother Poverty
In terms of single mother poverty, the demographic groups most similar to Immigrants from Albania are Estonian (27.8%, a difference of 0.030%), Romanian (27.8%, a difference of 0.12%), Immigrants from France (27.8%, a difference of 0.14%), Albanian (27.9%, a difference of 0.22%), and Chilean (27.9%, a difference of 0.25%).
| Demographics | Rating | Rank | Single Mother Poverty |
| Immigrants | Latvia | 98.7 /100 | #84 | Exceptional 27.7% |
| Mongolians | 98.7 /100 | #85 | Exceptional 27.7% |
| Immigrants | Ukraine | 98.6 /100 | #86 | Exceptional 27.7% |
| Afghans | 98.5 /100 | #87 | Exceptional 27.7% |
| Ethiopians | 98.4 /100 | #88 | Exceptional 27.7% |
| Immigrants | Ethiopia | 98.4 /100 | #89 | Exceptional 27.7% |
| Immigrants | France | 98.2 /100 | #90 | Exceptional 27.8% |
| Immigrants | Albania | 98.0 /100 | #91 | Exceptional 27.8% |
| Estonians | 97.9 /100 | #92 | Exceptional 27.8% |
| Romanians | 97.8 /100 | #93 | Exceptional 27.8% |
| Albanians | 97.6 /100 | #94 | Exceptional 27.9% |
| Chileans | 97.5 /100 | #95 | Exceptional 27.9% |
| Immigrants | Iraq | 97.3 /100 | #96 | Exceptional 27.9% |
| Immigrants | Brazil | 97.2 /100 | #97 | Exceptional 27.9% |
| Immigrants | Nepal | 97.2 /100 | #98 | Exceptional 27.9% |