Cree vs Scandinavian Single Mother Poverty
COMPARE
Cree
Scandinavian
Single Mother Poverty
Single Mother Poverty Comparison
Cree
Scandinavians
32.2%
SINGLE MOTHER POVERTY
0.0/ 100
METRIC RATING
281st/ 347
METRIC RANK
28.9%
SINGLE MOTHER POVERTY
66.2/ 100
METRIC RATING
162nd/ 347
METRIC RANK
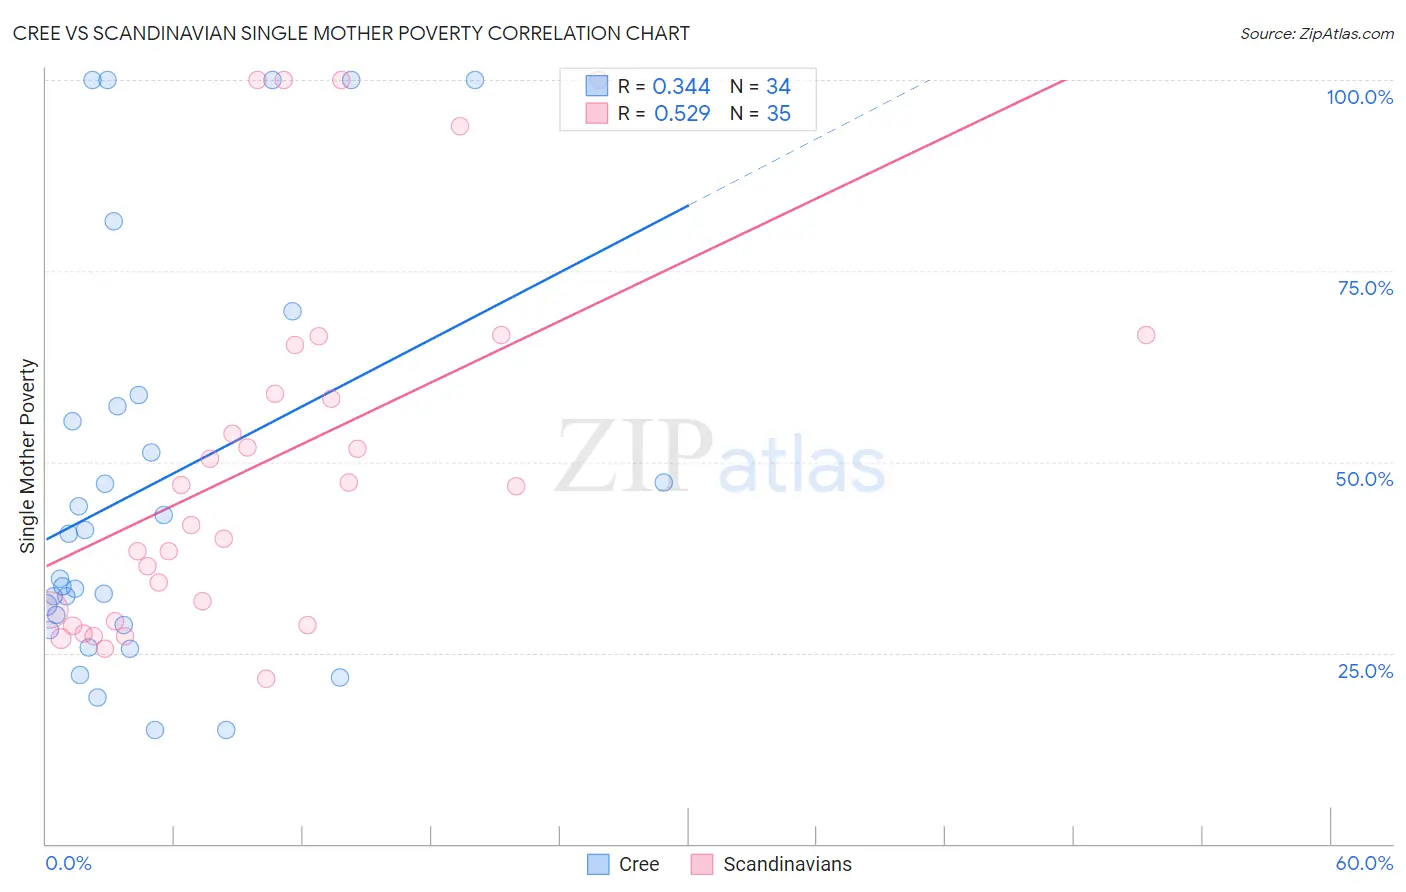
Cree vs Scandinavian Single Mother Poverty Correlation Chart
The statistical analysis conducted on geographies consisting of 75,775,779 people shows a mild positive correlation between the proportion of Cree and poverty level among single mothers in the United States with a correlation coefficient (R) of 0.344 and weighted average of 32.2%. Similarly, the statistical analysis conducted on geographies consisting of 456,235,845 people shows a substantial positive correlation between the proportion of Scandinavians and poverty level among single mothers in the United States with a correlation coefficient (R) of 0.529 and weighted average of 28.9%, a difference of 11.2%.
Single Mother Poverty Correlation Summary
| Measurement | Cree | Scandinavian |
| Minimum | 14.9% | 21.6% |
| Maximum | 100.0% | 100.0% |
| Range | 85.1% | 78.4% |
| Mean | 47.0% | 50.2% |
| Median | 37.6% | 46.8% |
| Interquartile 25% (IQ1) | 28.6% | 29.1% |
| Interquartile 75% (IQ3) | 57.4% | 65.3% |
| Interquartile Range (IQR) | 28.8% | 36.2% |
| Standard Deviation (Sample) | 26.7% | 24.0% |
| Standard Deviation (Population) | 26.3% | 23.7% |
Similar Demographics by Single Mother Poverty
Demographics Similar to Cree by Single Mother Poverty
In terms of single mother poverty, the demographic groups most similar to Cree are Nonimmigrants (32.2%, a difference of 0.030%), Immigrants from the Azores (32.2%, a difference of 0.11%), Marshallese (32.1%, a difference of 0.24%), Spanish American (32.3%, a difference of 0.36%), and Immigrants from Zaire (32.0%, a difference of 0.64%).
| Demographics | Rating | Rank | Single Mother Poverty |
| Bangladeshis | 0.1 /100 | #274 | Tragic 31.7% |
| Central Americans | 0.1 /100 | #275 | Tragic 31.8% |
| Delaware | 0.0 /100 | #276 | Tragic 31.8% |
| Mexican American Indians | 0.0 /100 | #277 | Tragic 31.9% |
| Immigrants | Zaire | 0.0 /100 | #278 | Tragic 32.0% |
| Marshallese | 0.0 /100 | #279 | Tragic 32.1% |
| Immigrants | Nonimmigrants | 0.0 /100 | #280 | Tragic 32.2% |
| Cree | 0.0 /100 | #281 | Tragic 32.2% |
| Immigrants | Azores | 0.0 /100 | #282 | Tragic 32.2% |
| Spanish Americans | 0.0 /100 | #283 | Tragic 32.3% |
| Indonesians | 0.0 /100 | #284 | Tragic 32.4% |
| Immigrants | Latin America | 0.0 /100 | #285 | Tragic 32.4% |
| Yup'ik | 0.0 /100 | #286 | Tragic 32.5% |
| Immigrants | Dominica | 0.0 /100 | #287 | Tragic 32.5% |
| Somalis | 0.0 /100 | #288 | Tragic 32.6% |
Demographics Similar to Scandinavians by Single Mother Poverty
In terms of single mother poverty, the demographic groups most similar to Scandinavians are Immigrants from Cambodia (28.9%, a difference of 0.020%), Immigrants from Nigeria (28.9%, a difference of 0.020%), Immigrants from Kenya (28.9%, a difference of 0.020%), Japanese (28.9%, a difference of 0.10%), and Czech (28.9%, a difference of 0.12%).
| Demographics | Rating | Rank | Single Mother Poverty |
| Ugandans | 71.7 /100 | #155 | Good 28.8% |
| Iraqis | 71.5 /100 | #156 | Good 28.8% |
| Immigrants | Western Europe | 71.1 /100 | #157 | Good 28.9% |
| Immigrants | Hungary | 70.6 /100 | #158 | Good 28.9% |
| Czechs | 68.4 /100 | #159 | Good 28.9% |
| Japanese | 68.0 /100 | #160 | Good 28.9% |
| Immigrants | Cambodia | 66.6 /100 | #161 | Good 28.9% |
| Scandinavians | 66.2 /100 | #162 | Good 28.9% |
| Immigrants | Nigeria | 65.9 /100 | #163 | Good 28.9% |
| Immigrants | Kenya | 65.9 /100 | #164 | Good 28.9% |
| Arabs | 60.7 /100 | #165 | Good 29.0% |
| Inupiat | 60.4 /100 | #166 | Good 29.0% |
| Costa Ricans | 58.4 /100 | #167 | Average 29.0% |
| Europeans | 57.6 /100 | #168 | Average 29.1% |
| Immigrants | Uruguay | 57.2 /100 | #169 | Average 29.1% |