Comanche vs Immigrants from Lithuania Receiving Food Stamps
COMPARE
Comanche
Immigrants from Lithuania
Receiving Food Stamps
Receiving Food Stamps Comparison
Comanche
Immigrants from Lithuania
13.3%
RECEIVING FOOD STAMPS
2.4/ 100
METRIC RATING
234th/ 347
METRIC RANK
9.2%
RECEIVING FOOD STAMPS
99.8/ 100
METRIC RATING
29th/ 347
METRIC RANK
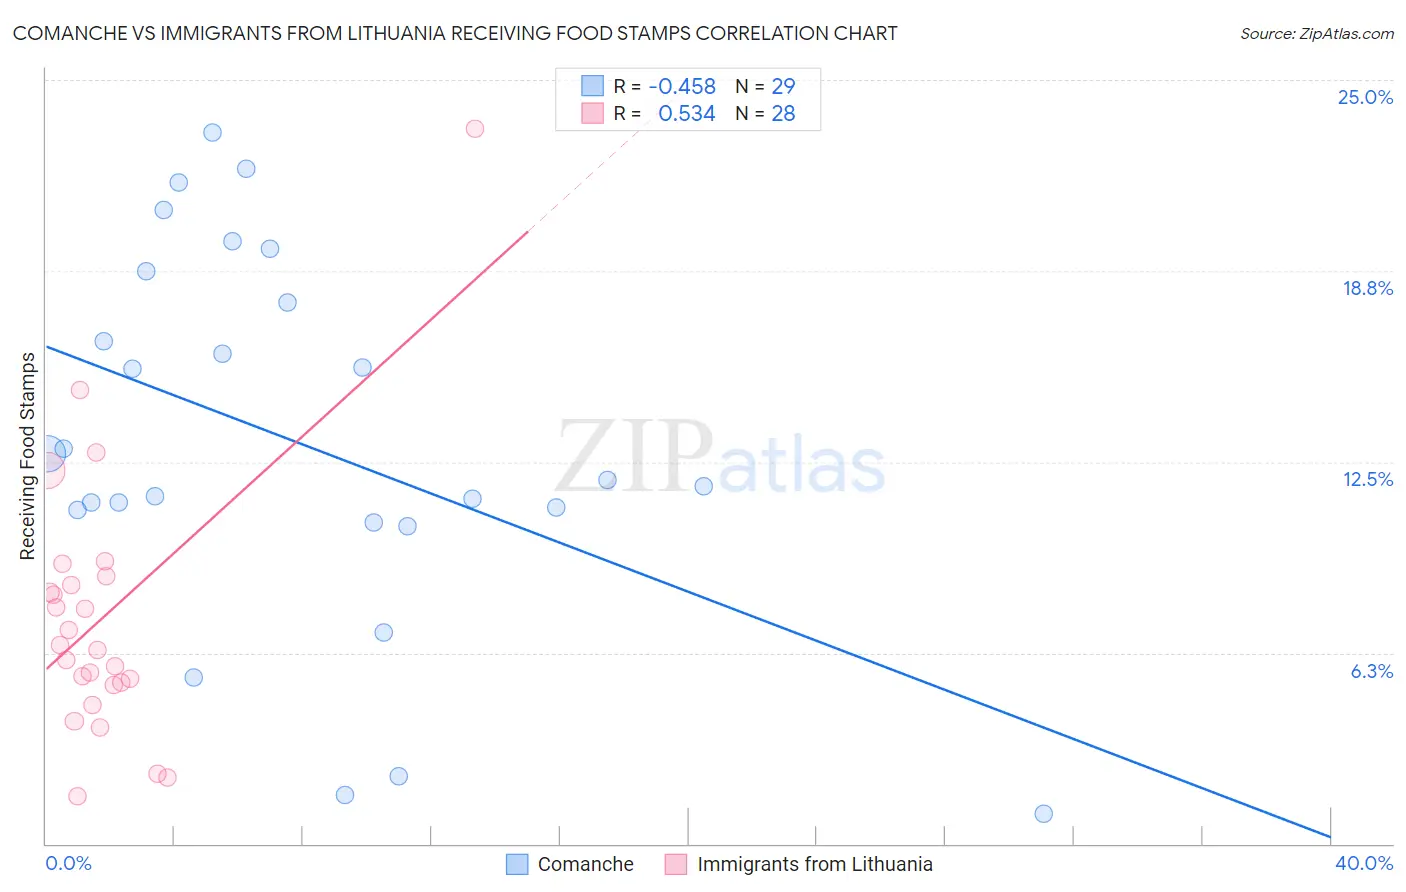
Comanche vs Immigrants from Lithuania Receiving Food Stamps Correlation Chart
The statistical analysis conducted on geographies consisting of 109,741,835 people shows a moderate negative correlation between the proportion of Comanche and percentage of population receiving government assistance and/or food stamps in the United States with a correlation coefficient (R) of -0.458 and weighted average of 13.3%. Similarly, the statistical analysis conducted on geographies consisting of 117,609,856 people shows a substantial positive correlation between the proportion of Immigrants from Lithuania and percentage of population receiving government assistance and/or food stamps in the United States with a correlation coefficient (R) of 0.534 and weighted average of 9.2%, a difference of 43.4%.
Receiving Food Stamps Correlation Summary
| Measurement | Comanche | Immigrants from Lithuania |
| Minimum | 1.0% | 1.6% |
| Maximum | 23.3% | 23.4% |
| Range | 22.3% | 21.8% |
| Mean | 13.1% | 7.4% |
| Median | 11.9% | 6.4% |
| Interquartile 25% (IQ1) | 10.7% | 5.2% |
| Interquartile 75% (IQ3) | 18.2% | 8.6% |
| Interquartile Range (IQR) | 7.5% | 3.4% |
| Standard Deviation (Sample) | 6.0% | 4.4% |
| Standard Deviation (Population) | 5.9% | 4.3% |
Similar Demographics by Receiving Food Stamps
Demographics Similar to Comanche by Receiving Food Stamps
In terms of receiving food stamps, the demographic groups most similar to Comanche are Cherokee (13.2%, a difference of 0.13%), Salvadoran (13.2%, a difference of 0.38%), Immigrants from Zaire (13.4%, a difference of 0.77%), Immigrants from Nigeria (13.1%, a difference of 1.1%), and Puget Sound Salish (13.1%, a difference of 1.1%).
| Demographics | Rating | Rank | Receiving Food Stamps |
| Nigerians | 3.5 /100 | #227 | Tragic 13.1% |
| Panamanians | 3.5 /100 | #228 | Tragic 13.1% |
| Ottawa | 3.5 /100 | #229 | Tragic 13.1% |
| Puget Sound Salish | 3.4 /100 | #230 | Tragic 13.1% |
| Immigrants | Nigeria | 3.4 /100 | #231 | Tragic 13.1% |
| Salvadorans | 2.7 /100 | #232 | Tragic 13.2% |
| Cherokee | 2.5 /100 | #233 | Tragic 13.2% |
| Comanche | 2.4 /100 | #234 | Tragic 13.3% |
| Immigrants | Zaire | 1.9 /100 | #235 | Tragic 13.4% |
| Crow | 1.6 /100 | #236 | Tragic 13.4% |
| Immigrants | El Salvador | 1.5 /100 | #237 | Tragic 13.5% |
| French American Indians | 1.4 /100 | #238 | Tragic 13.5% |
| Immigrants | Micronesia | 1.3 /100 | #239 | Tragic 13.5% |
| Iroquois | 1.2 /100 | #240 | Tragic 13.5% |
| Choctaw | 1.0 /100 | #241 | Tragic 13.6% |
Demographics Similar to Immigrants from Lithuania by Receiving Food Stamps
In terms of receiving food stamps, the demographic groups most similar to Immigrants from Lithuania are Czech (9.2%, a difference of 0.27%), Bhutanese (9.2%, a difference of 0.28%), Immigrants from Sweden (9.3%, a difference of 0.37%), Swedish (9.2%, a difference of 0.52%), and Immigrants from Ireland (9.2%, a difference of 0.72%).
| Demographics | Rating | Rank | Receiving Food Stamps |
| Immigrants | Australia | 99.8 /100 | #22 | Exceptional 9.2% |
| Eastern Europeans | 99.8 /100 | #23 | Exceptional 9.2% |
| Immigrants | Northern Europe | 99.8 /100 | #24 | Exceptional 9.2% |
| Immigrants | Ireland | 99.8 /100 | #25 | Exceptional 9.2% |
| Swedes | 99.8 /100 | #26 | Exceptional 9.2% |
| Bhutanese | 99.8 /100 | #27 | Exceptional 9.2% |
| Czechs | 99.8 /100 | #28 | Exceptional 9.2% |
| Immigrants | Lithuania | 99.8 /100 | #29 | Exceptional 9.2% |
| Immigrants | Sweden | 99.7 /100 | #30 | Exceptional 9.3% |
| Immigrants | Eastern Asia | 99.7 /100 | #31 | Exceptional 9.3% |
| Bolivians | 99.7 /100 | #32 | Exceptional 9.3% |
| Zimbabweans | 99.6 /100 | #33 | Exceptional 9.5% |
| Turks | 99.6 /100 | #34 | Exceptional 9.5% |
| Immigrants | Austria | 99.6 /100 | #35 | Exceptional 9.5% |
| Estonians | 99.6 /100 | #36 | Exceptional 9.5% |