Comanche vs Potawatomi Receiving Food Stamps
COMPARE
Comanche
Potawatomi
Receiving Food Stamps
Receiving Food Stamps Comparison
Comanche
Potawatomi
13.3%
RECEIVING FOOD STAMPS
2.4/ 100
METRIC RATING
234th/ 347
METRIC RANK
12.5%
RECEIVING FOOD STAMPS
14.6/ 100
METRIC RATING
208th/ 347
METRIC RANK
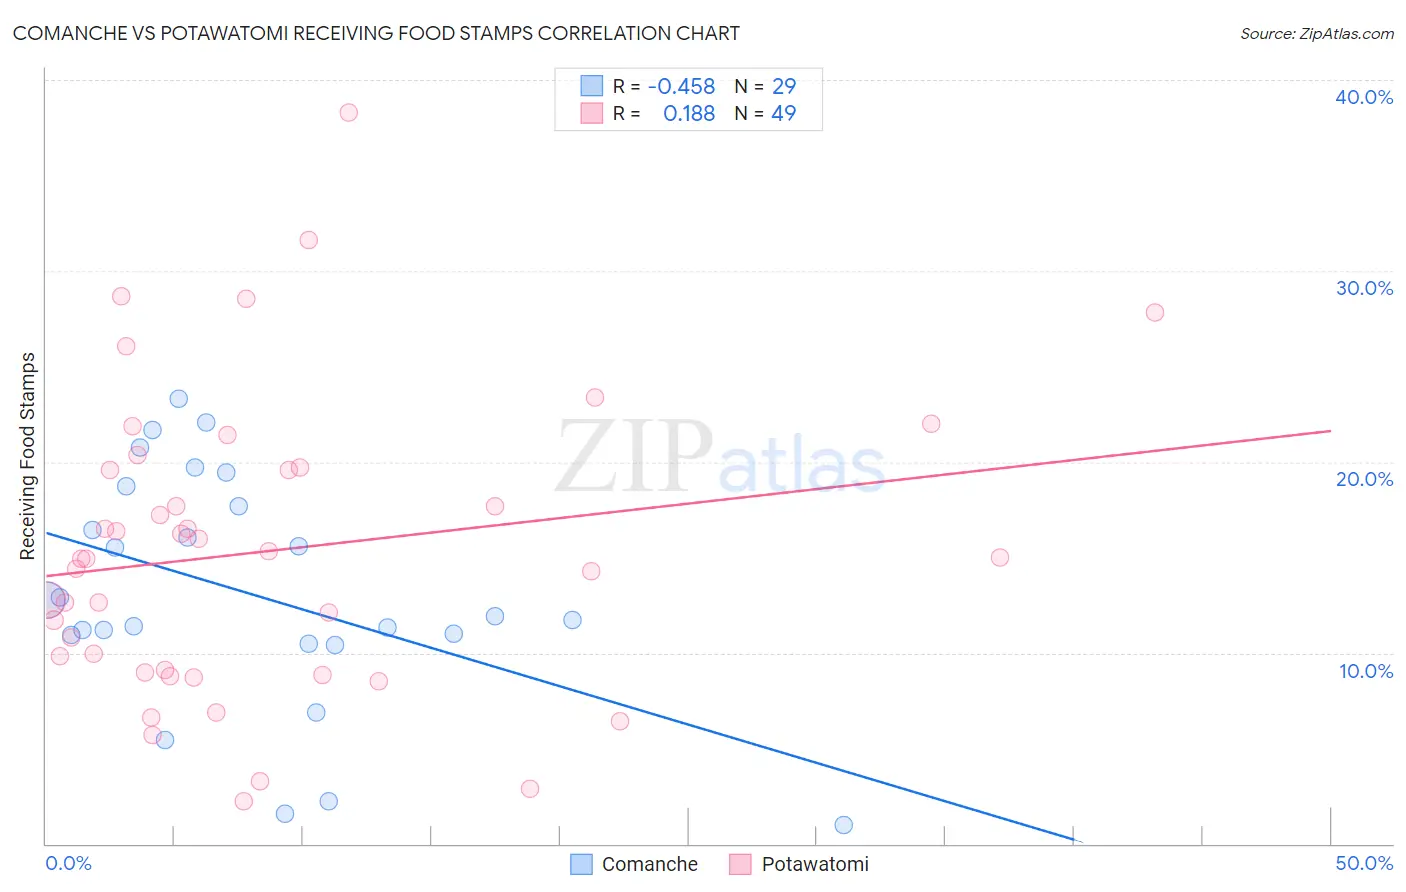
Comanche vs Potawatomi Receiving Food Stamps Correlation Chart
The statistical analysis conducted on geographies consisting of 109,741,835 people shows a moderate negative correlation between the proportion of Comanche and percentage of population receiving government assistance and/or food stamps in the United States with a correlation coefficient (R) of -0.458 and weighted average of 13.3%. Similarly, the statistical analysis conducted on geographies consisting of 117,725,542 people shows a poor positive correlation between the proportion of Potawatomi and percentage of population receiving government assistance and/or food stamps in the United States with a correlation coefficient (R) of 0.188 and weighted average of 12.5%, a difference of 6.4%.
Receiving Food Stamps Correlation Summary
| Measurement | Comanche | Potawatomi |
| Minimum | 1.0% | 2.2% |
| Maximum | 23.3% | 38.3% |
| Range | 22.3% | 36.1% |
| Mean | 13.1% | 15.3% |
| Median | 11.9% | 15.0% |
| Interquartile 25% (IQ1) | 10.7% | 9.1% |
| Interquartile 75% (IQ3) | 18.2% | 19.6% |
| Interquartile Range (IQR) | 7.5% | 10.6% |
| Standard Deviation (Sample) | 6.0% | 7.7% |
| Standard Deviation (Population) | 5.9% | 7.7% |
Similar Demographics by Receiving Food Stamps
Demographics Similar to Comanche by Receiving Food Stamps
In terms of receiving food stamps, the demographic groups most similar to Comanche are Cherokee (13.2%, a difference of 0.13%), Salvadoran (13.2%, a difference of 0.38%), Immigrants from Zaire (13.4%, a difference of 0.77%), Immigrants from Nigeria (13.1%, a difference of 1.1%), and Puget Sound Salish (13.1%, a difference of 1.1%).
| Demographics | Rating | Rank | Receiving Food Stamps |
| Nigerians | 3.5 /100 | #227 | Tragic 13.1% |
| Panamanians | 3.5 /100 | #228 | Tragic 13.1% |
| Ottawa | 3.5 /100 | #229 | Tragic 13.1% |
| Puget Sound Salish | 3.4 /100 | #230 | Tragic 13.1% |
| Immigrants | Nigeria | 3.4 /100 | #231 | Tragic 13.1% |
| Salvadorans | 2.7 /100 | #232 | Tragic 13.2% |
| Cherokee | 2.5 /100 | #233 | Tragic 13.2% |
| Comanche | 2.4 /100 | #234 | Tragic 13.3% |
| Immigrants | Zaire | 1.9 /100 | #235 | Tragic 13.4% |
| Crow | 1.6 /100 | #236 | Tragic 13.4% |
| Immigrants | El Salvador | 1.5 /100 | #237 | Tragic 13.5% |
| French American Indians | 1.4 /100 | #238 | Tragic 13.5% |
| Immigrants | Micronesia | 1.3 /100 | #239 | Tragic 13.5% |
| Iroquois | 1.2 /100 | #240 | Tragic 13.5% |
| Choctaw | 1.0 /100 | #241 | Tragic 13.6% |
Demographics Similar to Potawatomi by Receiving Food Stamps
In terms of receiving food stamps, the demographic groups most similar to Potawatomi are South American (12.4%, a difference of 0.36%), Immigrants from Sierra Leone (12.5%, a difference of 0.47%), Immigrants from Uruguay (12.5%, a difference of 0.50%), Immigrants from Thailand (12.4%, a difference of 0.62%), and Aleut (12.4%, a difference of 0.68%).
| Demographics | Rating | Rank | Receiving Food Stamps |
| Ugandans | 22.5 /100 | #201 | Fair 12.2% |
| Immigrants | Venezuela | 20.1 /100 | #202 | Fair 12.3% |
| Shoshone | 17.7 /100 | #203 | Poor 12.4% |
| Immigrants | Nonimmigrants | 17.6 /100 | #204 | Poor 12.4% |
| Aleuts | 17.3 /100 | #205 | Poor 12.4% |
| Immigrants | Thailand | 17.0 /100 | #206 | Poor 12.4% |
| South Americans | 16.0 /100 | #207 | Poor 12.4% |
| Potawatomi | 14.6 /100 | #208 | Poor 12.5% |
| Immigrants | Sierra Leone | 12.9 /100 | #209 | Poor 12.5% |
| Immigrants | Uruguay | 12.8 /100 | #210 | Poor 12.5% |
| Colombians | 10.2 /100 | #211 | Poor 12.6% |
| Malaysians | 8.5 /100 | #212 | Tragic 12.7% |
| Moroccans | 7.6 /100 | #213 | Tragic 12.8% |
| Immigrants | Africa | 7.6 /100 | #214 | Tragic 12.8% |
| Native Hawaiians | 6.7 /100 | #215 | Tragic 12.8% |