Comanche vs Yup'ik Receiving Food Stamps
COMPARE
Comanche
Yup'ik
Receiving Food Stamps
Receiving Food Stamps Comparison
Comanche
Yup'ik
13.3%
RECEIVING FOOD STAMPS
2.4/ 100
METRIC RATING
234th/ 347
METRIC RANK
32.7%
RECEIVING FOOD STAMPS
0.0/ 100
METRIC RATING
347th/ 347
METRIC RANK
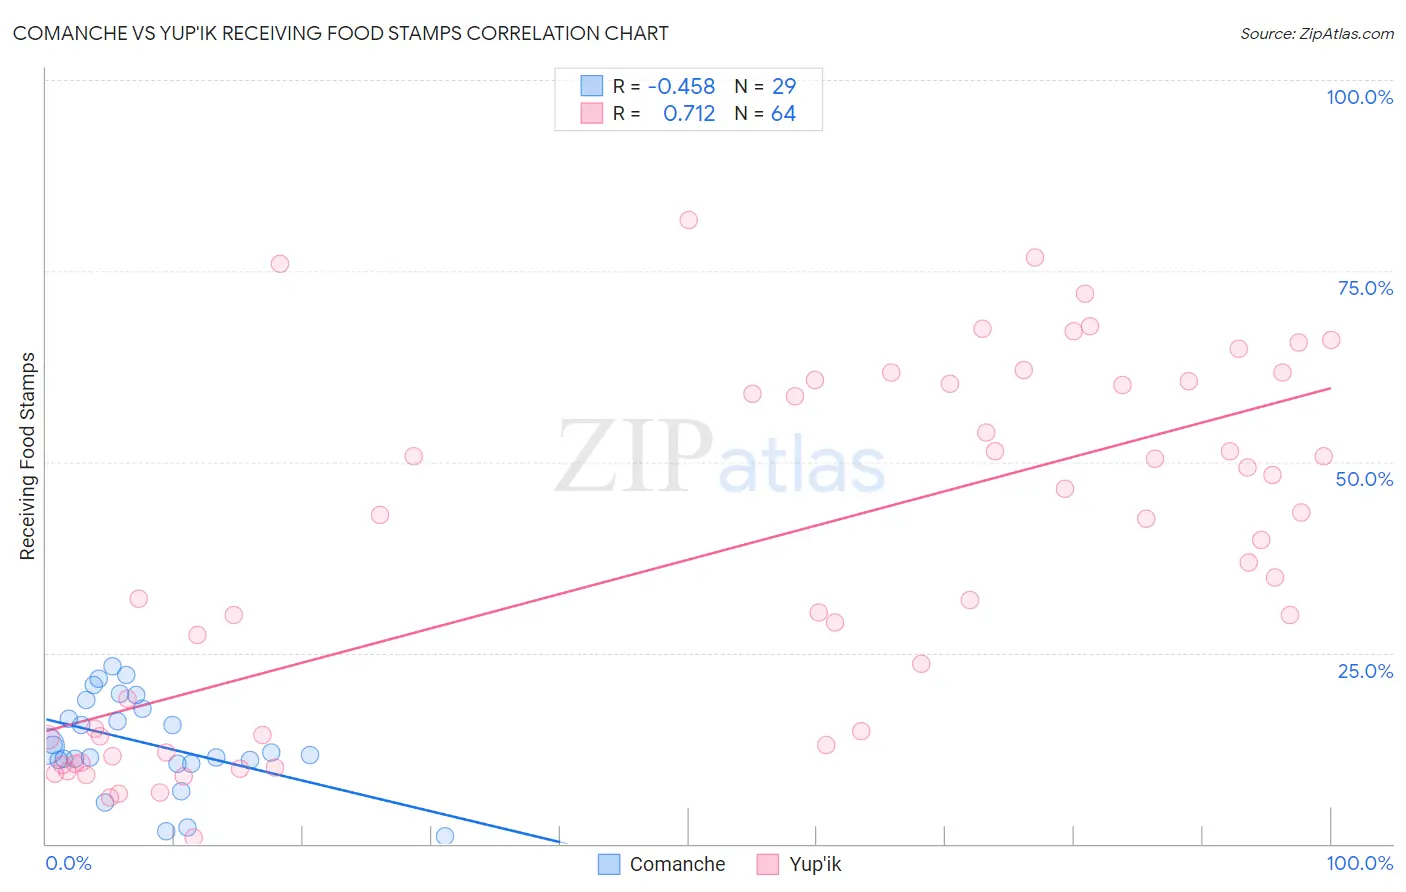
Comanche vs Yup'ik Receiving Food Stamps Correlation Chart
The statistical analysis conducted on geographies consisting of 109,741,835 people shows a moderate negative correlation between the proportion of Comanche and percentage of population receiving government assistance and/or food stamps in the United States with a correlation coefficient (R) of -0.458 and weighted average of 13.3%. Similarly, the statistical analysis conducted on geographies consisting of 39,947,156 people shows a strong positive correlation between the proportion of Yup'ik and percentage of population receiving government assistance and/or food stamps in the United States with a correlation coefficient (R) of 0.712 and weighted average of 32.7%, a difference of 146.4%.
Receiving Food Stamps Correlation Summary
| Measurement | Comanche | Yup'ik |
| Minimum | 1.0% | 0.80% |
| Maximum | 23.3% | 81.7% |
| Range | 22.3% | 80.9% |
| Mean | 13.1% | 37.7% |
| Median | 11.9% | 38.3% |
| Interquartile 25% (IQ1) | 10.7% | 13.5% |
| Interquartile 75% (IQ3) | 18.2% | 60.1% |
| Interquartile Range (IQR) | 7.5% | 46.6% |
| Standard Deviation (Sample) | 6.0% | 23.3% |
| Standard Deviation (Population) | 5.9% | 23.2% |
Similar Demographics by Receiving Food Stamps
Demographics Similar to Comanche by Receiving Food Stamps
In terms of receiving food stamps, the demographic groups most similar to Comanche are Cherokee (13.2%, a difference of 0.13%), Salvadoran (13.2%, a difference of 0.38%), Immigrants from Zaire (13.4%, a difference of 0.77%), Immigrants from Nigeria (13.1%, a difference of 1.1%), and Puget Sound Salish (13.1%, a difference of 1.1%).
| Demographics | Rating | Rank | Receiving Food Stamps |
| Nigerians | 3.5 /100 | #227 | Tragic 13.1% |
| Panamanians | 3.5 /100 | #228 | Tragic 13.1% |
| Ottawa | 3.5 /100 | #229 | Tragic 13.1% |
| Puget Sound Salish | 3.4 /100 | #230 | Tragic 13.1% |
| Immigrants | Nigeria | 3.4 /100 | #231 | Tragic 13.1% |
| Salvadorans | 2.7 /100 | #232 | Tragic 13.2% |
| Cherokee | 2.5 /100 | #233 | Tragic 13.2% |
| Comanche | 2.4 /100 | #234 | Tragic 13.3% |
| Immigrants | Zaire | 1.9 /100 | #235 | Tragic 13.4% |
| Crow | 1.6 /100 | #236 | Tragic 13.4% |
| Immigrants | El Salvador | 1.5 /100 | #237 | Tragic 13.5% |
| French American Indians | 1.4 /100 | #238 | Tragic 13.5% |
| Immigrants | Micronesia | 1.3 /100 | #239 | Tragic 13.5% |
| Iroquois | 1.2 /100 | #240 | Tragic 13.5% |
| Choctaw | 1.0 /100 | #241 | Tragic 13.6% |
Demographics Similar to Yup'ik by Receiving Food Stamps
In terms of receiving food stamps, the demographic groups most similar to Yup'ik are Puerto Rican (26.0%, a difference of 25.9%), Immigrants from Cabo Verde (23.8%, a difference of 37.0%), Lumbee (22.9%, a difference of 42.6%), Immigrants from Dominican Republic (22.1%, a difference of 47.7%), and Immigrants from Yemen (21.6%, a difference of 51.0%).
| Demographics | Rating | Rank | Receiving Food Stamps |
| Inupiat | 0.0 /100 | #333 | Tragic 20.1% |
| Yuman | 0.0 /100 | #334 | Tragic 20.2% |
| Immigrants | Cuba | 0.0 /100 | #335 | Tragic 20.8% |
| Navajo | 0.0 /100 | #336 | Tragic 21.1% |
| Cape Verdeans | 0.0 /100 | #337 | Tragic 21.1% |
| Dominicans | 0.0 /100 | #338 | Tragic 21.4% |
| Yakama | 0.0 /100 | #339 | Tragic 21.4% |
| Tohono O'odham | 0.0 /100 | #340 | Tragic 21.5% |
| Hopi | 0.0 /100 | #341 | Tragic 21.6% |
| Immigrants | Yemen | 0.0 /100 | #342 | Tragic 21.6% |
| Immigrants | Dominican Republic | 0.0 /100 | #343 | Tragic 22.1% |
| Lumbee | 0.0 /100 | #344 | Tragic 22.9% |
| Immigrants | Cabo Verde | 0.0 /100 | #345 | Tragic 23.8% |
| Puerto Ricans | 0.0 /100 | #346 | Tragic 26.0% |
| Yup'ik | 0.0 /100 | #347 | Tragic 32.7% |