Comanche vs Korean Professional Degree
COMPARE
Comanche
Korean
Professional Degree
Professional Degree Comparison
Comanche
Koreans
3.5%
PROFESSIONAL DEGREE
0.4/ 100
METRIC RATING
283rd/ 347
METRIC RANK
4.1%
PROFESSIONAL DEGREE
10.7/ 100
METRIC RATING
213th/ 347
METRIC RANK
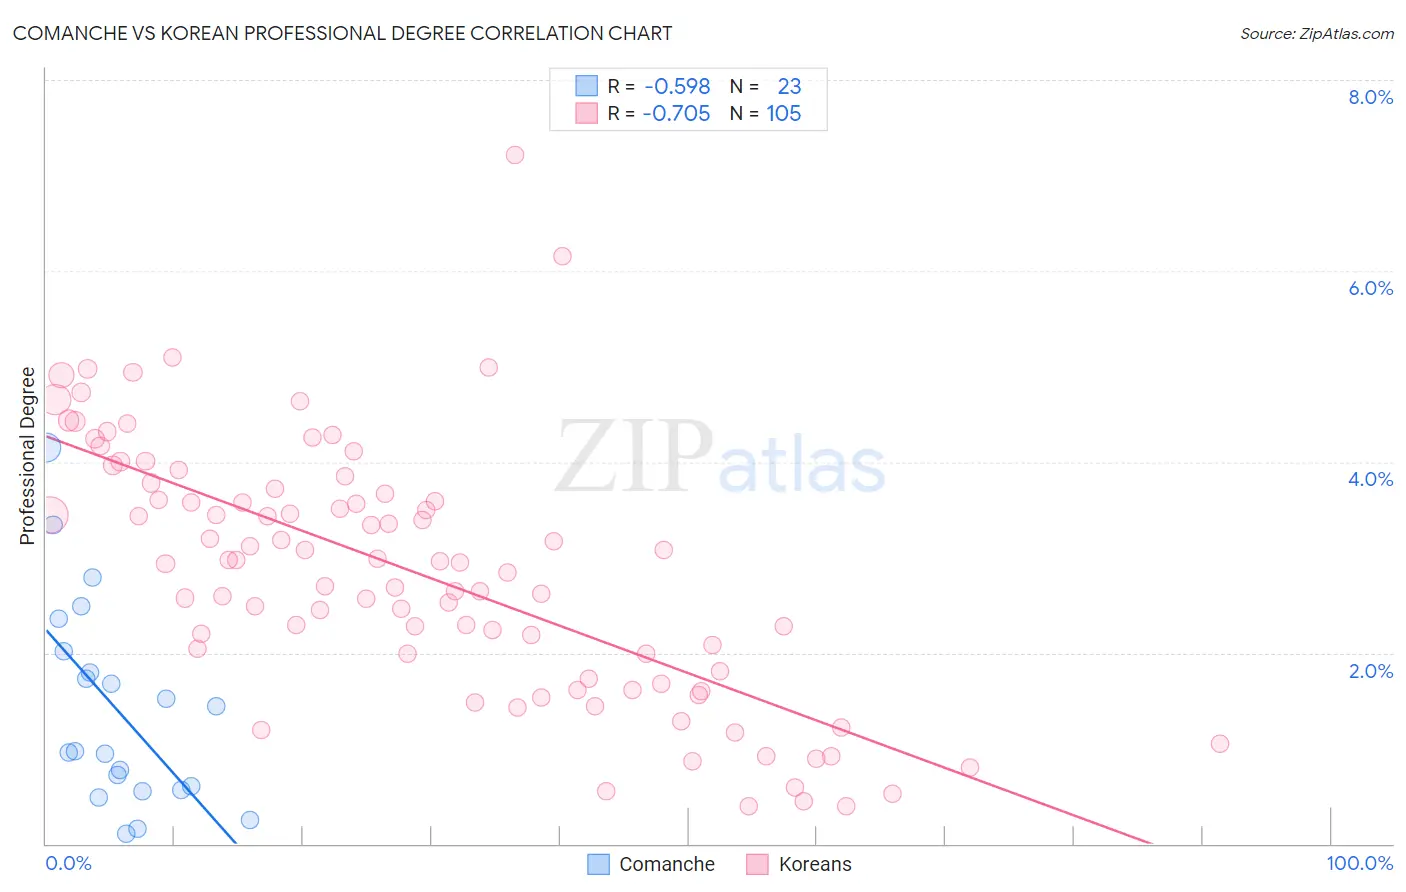
Comanche vs Korean Professional Degree Correlation Chart
The statistical analysis conducted on geographies consisting of 109,559,847 people shows a substantial negative correlation between the proportion of Comanche and percentage of population with at least professional degree education in the United States with a correlation coefficient (R) of -0.598 and weighted average of 3.5%. Similarly, the statistical analysis conducted on geographies consisting of 508,138,227 people shows a strong negative correlation between the proportion of Koreans and percentage of population with at least professional degree education in the United States with a correlation coefficient (R) of -0.705 and weighted average of 4.1%, a difference of 15.1%.
Professional Degree Correlation Summary
| Measurement | Comanche | Korean |
| Minimum | 0.11% | 0.39% |
| Maximum | 4.1% | 7.2% |
| Range | 4.0% | 6.8% |
| Mean | 1.4% | 2.8% |
| Median | 0.97% | 2.9% |
| Interquartile 25% (IQ1) | 0.57% | 1.8% |
| Interquartile 75% (IQ3) | 2.0% | 3.7% |
| Interquartile Range (IQR) | 1.4% | 1.9% |
| Standard Deviation (Sample) | 1.1% | 1.3% |
| Standard Deviation (Population) | 1.0% | 1.3% |
Similar Demographics by Professional Degree
Demographics Similar to Comanche by Professional Degree
In terms of professional degree, the demographic groups most similar to Comanche are Salvadoran (3.5%, a difference of 0.10%), Immigrants from Caribbean (3.5%, a difference of 0.30%), Apache (3.5%, a difference of 0.32%), Dominican (3.5%, a difference of 0.34%), and Immigrants from Portugal (3.5%, a difference of 0.38%).
| Demographics | Rating | Rank | Professional Degree |
| Liberians | 0.5 /100 | #276 | Tragic 3.6% |
| Cheyenne | 0.5 /100 | #277 | Tragic 3.6% |
| Japanese | 0.5 /100 | #278 | Tragic 3.5% |
| Immigrants | Portugal | 0.5 /100 | #279 | Tragic 3.5% |
| Dominicans | 0.5 /100 | #280 | Tragic 3.5% |
| Apache | 0.5 /100 | #281 | Tragic 3.5% |
| Immigrants | Caribbean | 0.5 /100 | #282 | Tragic 3.5% |
| Comanche | 0.4 /100 | #283 | Tragic 3.5% |
| Salvadorans | 0.4 /100 | #284 | Tragic 3.5% |
| Hondurans | 0.3 /100 | #285 | Tragic 3.5% |
| Haitians | 0.3 /100 | #286 | Tragic 3.5% |
| Immigrants | El Salvador | 0.3 /100 | #287 | Tragic 3.5% |
| Blackfeet | 0.3 /100 | #288 | Tragic 3.5% |
| Guatemalans | 0.3 /100 | #289 | Tragic 3.5% |
| Chippewa | 0.3 /100 | #290 | Tragic 3.5% |
Demographics Similar to Koreans by Professional Degree
In terms of professional degree, the demographic groups most similar to Koreans are Immigrants from Ghana (4.1%, a difference of 0.050%), Portuguese (4.1%, a difference of 0.10%), White/Caucasian (4.1%, a difference of 0.18%), German (4.1%, a difference of 0.36%), and Immigrants from Nigeria (4.1%, a difference of 0.39%).
| Demographics | Rating | Rank | Professional Degree |
| Yugoslavians | 13.4 /100 | #206 | Poor 4.1% |
| Sub-Saharan Africans | 12.8 /100 | #207 | Poor 4.1% |
| Immigrants | Somalia | 12.5 /100 | #208 | Poor 4.1% |
| Immigrants | Panama | 12.3 /100 | #209 | Poor 4.1% |
| Immigrants | Nigeria | 11.7 /100 | #210 | Poor 4.1% |
| Germans | 11.6 /100 | #211 | Poor 4.1% |
| Whites/Caucasians | 11.2 /100 | #212 | Poor 4.1% |
| Koreans | 10.7 /100 | #213 | Poor 4.1% |
| Immigrants | Ghana | 10.6 /100 | #214 | Poor 4.1% |
| Portuguese | 10.5 /100 | #215 | Poor 4.1% |
| West Indians | 9.8 /100 | #216 | Tragic 4.1% |
| Immigrants | Vietnam | 9.4 /100 | #217 | Tragic 4.0% |
| Dutch | 9.0 /100 | #218 | Tragic 4.0% |
| Immigrants | South Eastern Asia | 8.9 /100 | #219 | Tragic 4.0% |
| Ute | 8.2 /100 | #220 | Tragic 4.0% |