Comanche vs Immigrants from South Central Asia In Labor Force | Age > 16
COMPARE
Comanche
Immigrants from South Central Asia
In Labor Force | Age > 16
In Labor Force | Age > 16 Comparison
Comanche
Immigrants from South Central Asia
63.6%
IN LABOR FORCE | AGE > 16
0.0/ 100
METRIC RATING
298th/ 347
METRIC RANK
67.1%
IN LABOR FORCE | AGE > 16
100.0/ 100
METRIC RATING
35th/ 347
METRIC RANK
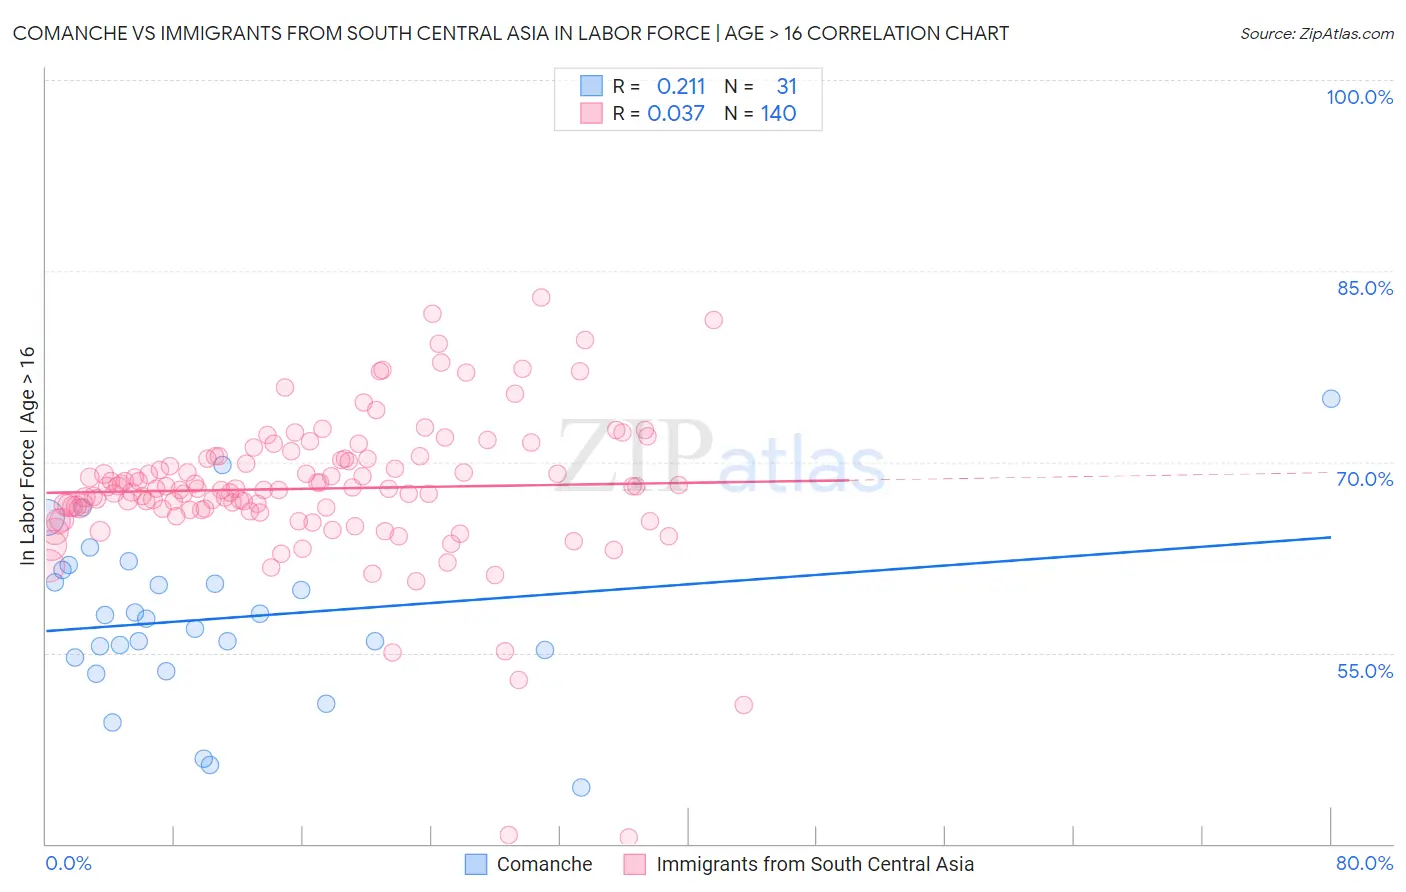
Comanche vs Immigrants from South Central Asia In Labor Force | Age > 16 Correlation Chart
The statistical analysis conducted on geographies consisting of 109,783,732 people shows a weak positive correlation between the proportion of Comanche and labor force participation rate among population ages 16 and over in the United States with a correlation coefficient (R) of 0.211 and weighted average of 63.6%. Similarly, the statistical analysis conducted on geographies consisting of 473,125,366 people shows no correlation between the proportion of Immigrants from South Central Asia and labor force participation rate among population ages 16 and over in the United States with a correlation coefficient (R) of 0.037 and weighted average of 67.1%, a difference of 5.4%.
In Labor Force | Age > 16 Correlation Summary
| Measurement | Comanche | Immigrants from South Central Asia |
| Minimum | 44.4% | 40.5% |
| Maximum | 75.0% | 82.9% |
| Range | 30.6% | 42.4% |
| Mean | 57.7% | 67.9% |
| Median | 57.7% | 67.9% |
| Interquartile 25% (IQ1) | 54.7% | 66.2% |
| Interquartile 75% (IQ3) | 61.5% | 70.2% |
| Interquartile Range (IQR) | 6.9% | 4.0% |
| Standard Deviation (Sample) | 6.6% | 5.9% |
| Standard Deviation (Population) | 6.5% | 5.9% |
Similar Demographics by In Labor Force | Age > 16
Demographics Similar to Comanche by In Labor Force | Age > 16
In terms of in labor force | age > 16, the demographic groups most similar to Comanche are Immigrants from Grenada (63.6%, a difference of 0.010%), White/Caucasian (63.6%, a difference of 0.060%), Immigrants from the Azores (63.6%, a difference of 0.060%), Immigrants from North America (63.7%, a difference of 0.090%), and Spanish American (63.6%, a difference of 0.090%).
| Demographics | Rating | Rank | In Labor Force | Age > 16 |
| Nepalese | 0.1 /100 | #291 | Tragic 63.8% |
| Spanish American Indians | 0.1 /100 | #292 | Tragic 63.8% |
| English | 0.1 /100 | #293 | Tragic 63.7% |
| Puget Sound Salish | 0.0 /100 | #294 | Tragic 63.7% |
| Immigrants | Canada | 0.0 /100 | #295 | Tragic 63.7% |
| Immigrants | North America | 0.0 /100 | #296 | Tragic 63.7% |
| Immigrants | Grenada | 0.0 /100 | #297 | Tragic 63.6% |
| Comanche | 0.0 /100 | #298 | Tragic 63.6% |
| Whites/Caucasians | 0.0 /100 | #299 | Tragic 63.6% |
| Immigrants | Azores | 0.0 /100 | #300 | Tragic 63.6% |
| Spanish Americans | 0.0 /100 | #301 | Tragic 63.6% |
| Delaware | 0.0 /100 | #302 | Tragic 63.6% |
| Cree | 0.0 /100 | #303 | Tragic 63.5% |
| Immigrants | Nonimmigrants | 0.0 /100 | #304 | Tragic 63.5% |
| Osage | 0.0 /100 | #305 | Tragic 63.5% |
Demographics Similar to Immigrants from South Central Asia by In Labor Force | Age > 16
In terms of in labor force | age > 16, the demographic groups most similar to Immigrants from South Central Asia are Immigrants from Western Africa (67.1%, a difference of 0.0%), Immigrants from Ghana (67.1%, a difference of 0.050%), Immigrants from Congo (67.1%, a difference of 0.070%), Afghan (67.1%, a difference of 0.070%), and Immigrants from Afghanistan (67.0%, a difference of 0.080%).
| Demographics | Rating | Rank | In Labor Force | Age > 16 |
| Immigrants | Morocco | 100.0 /100 | #28 | Exceptional 67.2% |
| Thais | 100.0 /100 | #29 | Exceptional 67.2% |
| Immigrants | Zaire | 100.0 /100 | #30 | Exceptional 67.2% |
| Ghanaians | 100.0 /100 | #31 | Exceptional 67.1% |
| Immigrants | Congo | 100.0 /100 | #32 | Exceptional 67.1% |
| Afghans | 100.0 /100 | #33 | Exceptional 67.1% |
| Immigrants | Ghana | 100.0 /100 | #34 | Exceptional 67.1% |
| Immigrants | South Central Asia | 100.0 /100 | #35 | Exceptional 67.1% |
| Immigrants | Western Africa | 100.0 /100 | #36 | Exceptional 67.1% |
| Immigrants | Afghanistan | 100.0 /100 | #37 | Exceptional 67.0% |
| Immigrants | Nigeria | 100.0 /100 | #38 | Exceptional 66.9% |
| Salvadorans | 100.0 /100 | #39 | Exceptional 66.8% |
| Immigrants | El Salvador | 100.0 /100 | #40 | Exceptional 66.8% |
| Immigrants | Zimbabwe | 100.0 /100 | #41 | Exceptional 66.8% |
| Senegalese | 100.0 /100 | #42 | Exceptional 66.7% |