Colville vs Tohono O'odham Male Poverty
COMPARE
Colville
Tohono O'odham
Male Poverty
Male Poverty Comparison
Colville
Tohono O'odham
15.2%
MALE POVERTY
0.0/ 100
METRIC RATING
323rd/ 347
METRIC RANK
22.9%
MALE POVERTY
0.0/ 100
METRIC RATING
347th/ 347
METRIC RANK
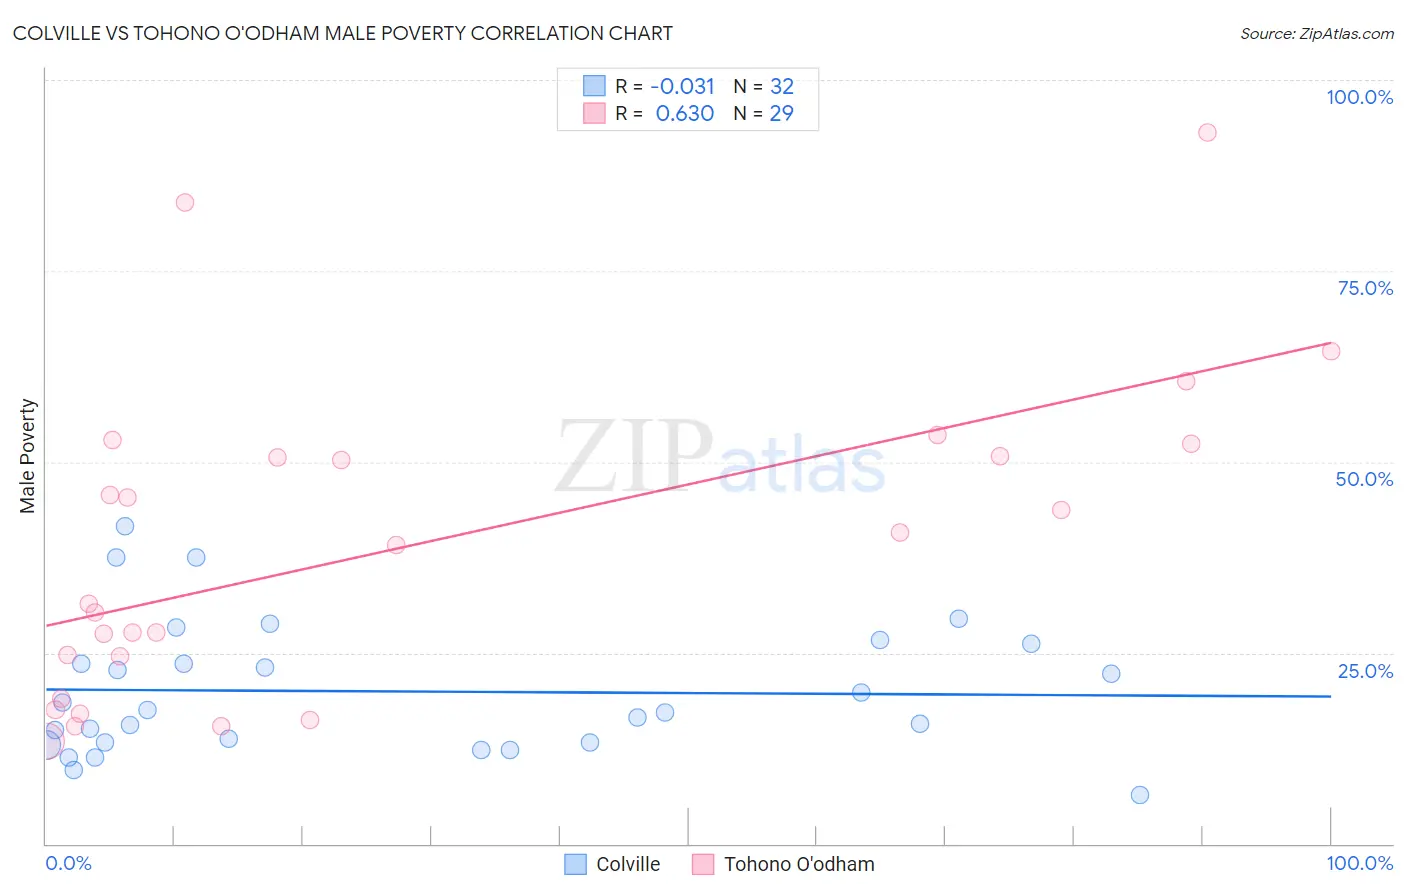
Colville vs Tohono O'odham Male Poverty Correlation Chart
The statistical analysis conducted on geographies consisting of 34,680,986 people shows no correlation between the proportion of Colville and poverty level among males in the United States with a correlation coefficient (R) of -0.031 and weighted average of 15.2%. Similarly, the statistical analysis conducted on geographies consisting of 58,718,302 people shows a significant positive correlation between the proportion of Tohono O'odham and poverty level among males in the United States with a correlation coefficient (R) of 0.630 and weighted average of 22.9%, a difference of 50.1%.
Male Poverty Correlation Summary
| Measurement | Colville | Tohono O'odham |
| Minimum | 6.3% | 13.4% |
| Maximum | 41.5% | 93.1% |
| Range | 35.2% | 79.8% |
| Mean | 20.0% | 39.1% |
| Median | 17.3% | 39.0% |
| Interquartile 25% (IQ1) | 13.3% | 21.8% |
| Interquartile 75% (IQ3) | 24.9% | 51.5% |
| Interquartile Range (IQR) | 11.7% | 29.8% |
| Standard Deviation (Sample) | 8.6% | 20.5% |
| Standard Deviation (Population) | 8.5% | 20.1% |
Similar Demographics by Male Poverty
Demographics Similar to Colville by Male Poverty
In terms of male poverty, the demographic groups most similar to Colville are Menominee (15.3%, a difference of 0.19%), Yakama (15.3%, a difference of 0.37%), Kiowa (15.2%, a difference of 0.39%), Central American Indian (15.3%, a difference of 0.48%), and Arapaho (15.1%, a difference of 1.1%).
| Demographics | Rating | Rank | Male Poverty |
| British West Indians | 0.0 /100 | #316 | Tragic 14.6% |
| Immigrants | Dominica | 0.0 /100 | #317 | Tragic 14.7% |
| Immigrants | Grenada | 0.0 /100 | #318 | Tragic 14.7% |
| U.S. Virgin Islanders | 0.0 /100 | #319 | Tragic 14.7% |
| Immigrants | Congo | 0.0 /100 | #320 | Tragic 14.7% |
| Arapaho | 0.0 /100 | #321 | Tragic 15.1% |
| Kiowa | 0.0 /100 | #322 | Tragic 15.2% |
| Colville | 0.0 /100 | #323 | Tragic 15.2% |
| Menominee | 0.0 /100 | #324 | Tragic 15.3% |
| Yakama | 0.0 /100 | #325 | Tragic 15.3% |
| Central American Indians | 0.0 /100 | #326 | Tragic 15.3% |
| Paiute | 0.0 /100 | #327 | Tragic 15.8% |
| Blacks/African Americans | 0.0 /100 | #328 | Tragic 15.8% |
| Dominicans | 0.0 /100 | #329 | Tragic 16.1% |
| Immigrants | Dominican Republic | 0.0 /100 | #330 | Tragic 16.2% |
Demographics Similar to Tohono O'odham by Male Poverty
In terms of male poverty, the demographic groups most similar to Tohono O'odham are Navajo (22.3%, a difference of 2.6%), Puerto Rican (22.0%, a difference of 3.9%), Hopi (20.8%, a difference of 10.0%), Yup'ik (20.4%, a difference of 12.3%), and Pima (20.4%, a difference of 12.4%).
| Demographics | Rating | Rank | Male Poverty |
| Natives/Alaskans | 0.0 /100 | #333 | Tragic 16.9% |
| Cheyenne | 0.0 /100 | #334 | Tragic 17.6% |
| Apache | 0.0 /100 | #335 | Tragic 17.7% |
| Pueblo | 0.0 /100 | #336 | Tragic 18.5% |
| Sioux | 0.0 /100 | #337 | Tragic 18.7% |
| Crow | 0.0 /100 | #338 | Tragic 19.1% |
| Yuman | 0.0 /100 | #339 | Tragic 19.5% |
| Immigrants | Yemen | 0.0 /100 | #340 | Tragic 20.1% |
| Lumbee | 0.0 /100 | #341 | Tragic 20.2% |
| Pima | 0.0 /100 | #342 | Tragic 20.4% |
| Yup'ik | 0.0 /100 | #343 | Tragic 20.4% |
| Hopi | 0.0 /100 | #344 | Tragic 20.8% |
| Puerto Ricans | 0.0 /100 | #345 | Tragic 22.0% |
| Navajo | 0.0 /100 | #346 | Tragic 22.3% |
| Tohono O'odham | 0.0 /100 | #347 | Tragic 22.9% |