Immigrants from Costa Rica vs Tohono O'odham Male Poverty
COMPARE
Immigrants from Costa Rica
Tohono O'odham
Male Poverty
Male Poverty Comparison
Immigrants from Costa Rica
Tohono O'odham
11.3%
MALE POVERTY
39.5/ 100
METRIC RATING
181st/ 347
METRIC RANK
22.9%
MALE POVERTY
0.0/ 100
METRIC RATING
347th/ 347
METRIC RANK
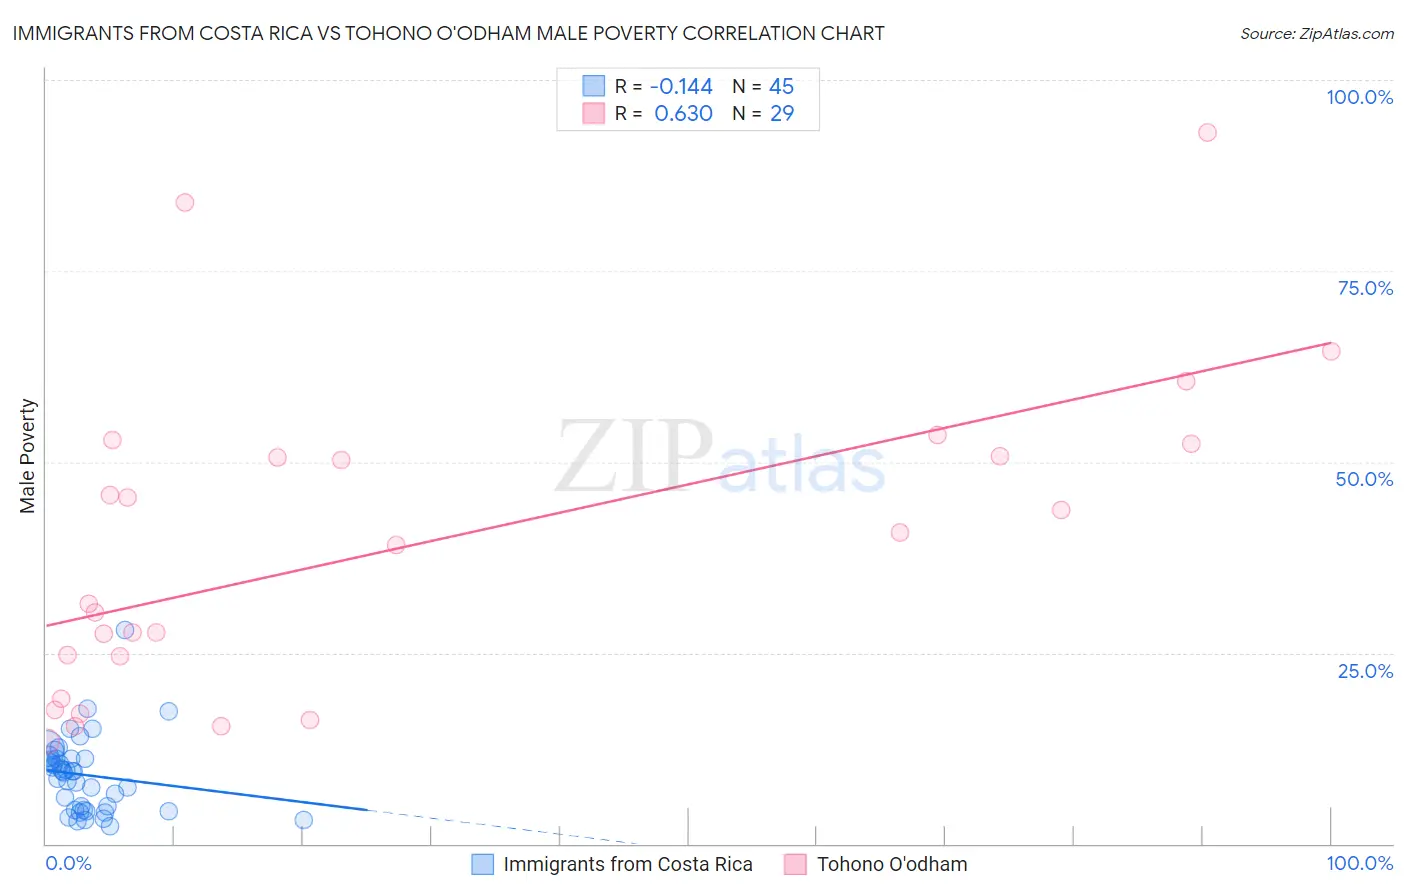
Immigrants from Costa Rica vs Tohono O'odham Male Poverty Correlation Chart
The statistical analysis conducted on geographies consisting of 204,239,377 people shows a poor negative correlation between the proportion of Immigrants from Costa Rica and poverty level among males in the United States with a correlation coefficient (R) of -0.144 and weighted average of 11.3%. Similarly, the statistical analysis conducted on geographies consisting of 58,718,302 people shows a significant positive correlation between the proportion of Tohono O'odham and poverty level among males in the United States with a correlation coefficient (R) of 0.630 and weighted average of 22.9%, a difference of 102.5%.
Male Poverty Correlation Summary
| Measurement | Immigrants from Costa Rica | Tohono O'odham |
| Minimum | 2.3% | 13.4% |
| Maximum | 28.0% | 93.1% |
| Range | 25.7% | 79.8% |
| Mean | 9.0% | 39.1% |
| Median | 9.5% | 39.0% |
| Interquartile 25% (IQ1) | 4.4% | 21.8% |
| Interquartile 75% (IQ3) | 11.1% | 51.5% |
| Interquartile Range (IQR) | 6.7% | 29.8% |
| Standard Deviation (Sample) | 4.9% | 20.5% |
| Standard Deviation (Population) | 4.9% | 20.1% |
Similar Demographics by Male Poverty
Demographics Similar to Immigrants from Costa Rica by Male Poverty
In terms of male poverty, the demographic groups most similar to Immigrants from Costa Rica are Mongolian (11.3%, a difference of 0.050%), Immigrants from Morocco (11.3%, a difference of 0.060%), Immigrants from Syria (11.3%, a difference of 0.080%), Kenyan (11.3%, a difference of 0.11%), and Immigrants from South America (11.3%, a difference of 0.27%).
| Demographics | Rating | Rank | Male Poverty |
| Immigrants | Oceania | 50.0 /100 | #174 | Average 11.2% |
| Celtics | 47.5 /100 | #175 | Average 11.2% |
| Immigrants | Fiji | 46.0 /100 | #176 | Average 11.2% |
| Lebanese | 45.6 /100 | #177 | Average 11.2% |
| Immigrants | Cameroon | 44.5 /100 | #178 | Average 11.2% |
| Immigrants | Syria | 40.3 /100 | #179 | Average 11.3% |
| Immigrants | Morocco | 40.1 /100 | #180 | Average 11.3% |
| Immigrants | Costa Rica | 39.5 /100 | #181 | Fair 11.3% |
| Mongolians | 39.0 /100 | #182 | Fair 11.3% |
| Kenyans | 38.4 /100 | #183 | Fair 11.3% |
| Immigrants | South America | 36.9 /100 | #184 | Fair 11.3% |
| Immigrants | Afghanistan | 33.3 /100 | #185 | Fair 11.4% |
| Immigrants | Sierra Leone | 32.9 /100 | #186 | Fair 11.4% |
| Immigrants | Iraq | 31.9 /100 | #187 | Fair 11.4% |
| Sierra Leoneans | 29.9 /100 | #188 | Fair 11.4% |
Demographics Similar to Tohono O'odham by Male Poverty
In terms of male poverty, the demographic groups most similar to Tohono O'odham are Navajo (22.3%, a difference of 2.6%), Puerto Rican (22.0%, a difference of 3.9%), Hopi (20.8%, a difference of 10.0%), Yup'ik (20.4%, a difference of 12.3%), and Pima (20.4%, a difference of 12.4%).
| Demographics | Rating | Rank | Male Poverty |
| Natives/Alaskans | 0.0 /100 | #333 | Tragic 16.9% |
| Cheyenne | 0.0 /100 | #334 | Tragic 17.6% |
| Apache | 0.0 /100 | #335 | Tragic 17.7% |
| Pueblo | 0.0 /100 | #336 | Tragic 18.5% |
| Sioux | 0.0 /100 | #337 | Tragic 18.7% |
| Crow | 0.0 /100 | #338 | Tragic 19.1% |
| Yuman | 0.0 /100 | #339 | Tragic 19.5% |
| Immigrants | Yemen | 0.0 /100 | #340 | Tragic 20.1% |
| Lumbee | 0.0 /100 | #341 | Tragic 20.2% |
| Pima | 0.0 /100 | #342 | Tragic 20.4% |
| Yup'ik | 0.0 /100 | #343 | Tragic 20.4% |
| Hopi | 0.0 /100 | #344 | Tragic 20.8% |
| Puerto Ricans | 0.0 /100 | #345 | Tragic 22.0% |
| Navajo | 0.0 /100 | #346 | Tragic 22.3% |
| Tohono O'odham | 0.0 /100 | #347 | Tragic 22.9% |