Colville vs Armenian Male Poverty
COMPARE
Colville
Armenian
Male Poverty
Male Poverty Comparison
Colville
Armenians
15.2%
MALE POVERTY
0.0/ 100
METRIC RATING
323rd/ 347
METRIC RANK
11.0%
MALE POVERTY
68.0/ 100
METRIC RATING
148th/ 347
METRIC RANK
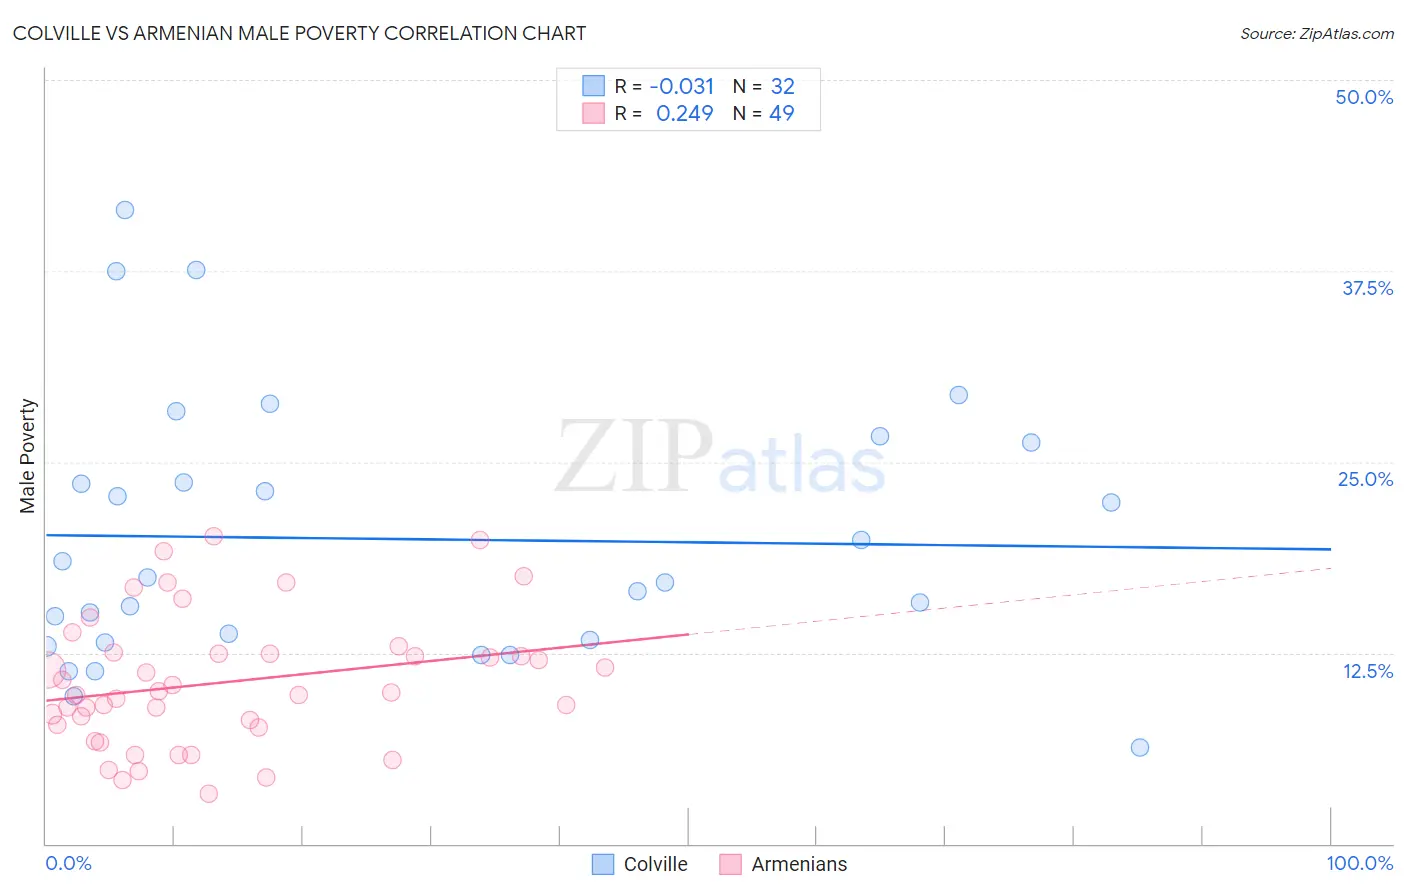
Colville vs Armenian Male Poverty Correlation Chart
The statistical analysis conducted on geographies consisting of 34,680,986 people shows no correlation between the proportion of Colville and poverty level among males in the United States with a correlation coefficient (R) of -0.031 and weighted average of 15.2%. Similarly, the statistical analysis conducted on geographies consisting of 310,692,153 people shows a weak positive correlation between the proportion of Armenians and poverty level among males in the United States with a correlation coefficient (R) of 0.249 and weighted average of 11.0%, a difference of 38.8%.
Male Poverty Correlation Summary
| Measurement | Colville | Armenian |
| Minimum | 6.3% | 3.2% |
| Maximum | 41.5% | 20.1% |
| Range | 35.2% | 16.9% |
| Mean | 20.0% | 10.6% |
| Median | 17.3% | 9.9% |
| Interquartile 25% (IQ1) | 13.3% | 7.7% |
| Interquartile 75% (IQ3) | 24.9% | 12.5% |
| Interquartile Range (IQR) | 11.7% | 4.8% |
| Standard Deviation (Sample) | 8.6% | 4.3% |
| Standard Deviation (Population) | 8.5% | 4.2% |
Similar Demographics by Male Poverty
Demographics Similar to Colville by Male Poverty
In terms of male poverty, the demographic groups most similar to Colville are Menominee (15.3%, a difference of 0.19%), Yakama (15.3%, a difference of 0.37%), Kiowa (15.2%, a difference of 0.39%), Central American Indian (15.3%, a difference of 0.48%), and Arapaho (15.1%, a difference of 1.1%).
| Demographics | Rating | Rank | Male Poverty |
| British West Indians | 0.0 /100 | #316 | Tragic 14.6% |
| Immigrants | Dominica | 0.0 /100 | #317 | Tragic 14.7% |
| Immigrants | Grenada | 0.0 /100 | #318 | Tragic 14.7% |
| U.S. Virgin Islanders | 0.0 /100 | #319 | Tragic 14.7% |
| Immigrants | Congo | 0.0 /100 | #320 | Tragic 14.7% |
| Arapaho | 0.0 /100 | #321 | Tragic 15.1% |
| Kiowa | 0.0 /100 | #322 | Tragic 15.2% |
| Colville | 0.0 /100 | #323 | Tragic 15.2% |
| Menominee | 0.0 /100 | #324 | Tragic 15.3% |
| Yakama | 0.0 /100 | #325 | Tragic 15.3% |
| Central American Indians | 0.0 /100 | #326 | Tragic 15.3% |
| Paiute | 0.0 /100 | #327 | Tragic 15.8% |
| Blacks/African Americans | 0.0 /100 | #328 | Tragic 15.8% |
| Dominicans | 0.0 /100 | #329 | Tragic 16.1% |
| Immigrants | Dominican Republic | 0.0 /100 | #330 | Tragic 16.2% |
Demographics Similar to Armenians by Male Poverty
In terms of male poverty, the demographic groups most similar to Armenians are Immigrants from Venezuela (11.0%, a difference of 0.020%), Icelander (11.0%, a difference of 0.050%), Guamanian/Chamorro (11.0%, a difference of 0.050%), Venezuelan (11.0%, a difference of 0.080%), and Immigrants from Nepal (11.0%, a difference of 0.080%).
| Demographics | Rating | Rank | Male Poverty |
| Immigrants | France | 75.8 /100 | #141 | Good 10.9% |
| Basques | 74.6 /100 | #142 | Good 10.9% |
| Afghans | 71.9 /100 | #143 | Good 10.9% |
| Samoans | 71.8 /100 | #144 | Good 10.9% |
| Immigrants | Germany | 71.6 /100 | #145 | Good 10.9% |
| Syrians | 71.4 /100 | #146 | Good 10.9% |
| Icelanders | 68.5 /100 | #147 | Good 11.0% |
| Armenians | 68.0 /100 | #148 | Good 11.0% |
| Immigrants | Venezuela | 67.9 /100 | #149 | Good 11.0% |
| Guamanians/Chamorros | 67.6 /100 | #150 | Good 11.0% |
| Venezuelans | 67.4 /100 | #151 | Good 11.0% |
| Immigrants | Nepal | 67.3 /100 | #152 | Good 11.0% |
| Immigrants | Bosnia and Herzegovina | 65.2 /100 | #153 | Good 11.0% |
| Immigrants | Kazakhstan | 64.8 /100 | #154 | Good 11.0% |
| Immigrants | Malaysia | 64.7 /100 | #155 | Good 11.0% |