Colville vs Kiowa Unemployment Among Ages 16 to 19 years
COMPARE
Colville
Kiowa
Unemployment Among Ages 16 to 19 years
Unemployment Among Ages 16 to 19 years Comparison
Colville
Kiowa
29.7%
UNEMPLOYMENT AMONG AGES 16 TO 19 YEARS
0.0/ 100
METRIC RATING
344th/ 347
METRIC RANK
25.2%
UNEMPLOYMENT AMONG AGES 16 TO 19 YEARS
0.0/ 100
METRIC RATING
336th/ 347
METRIC RANK
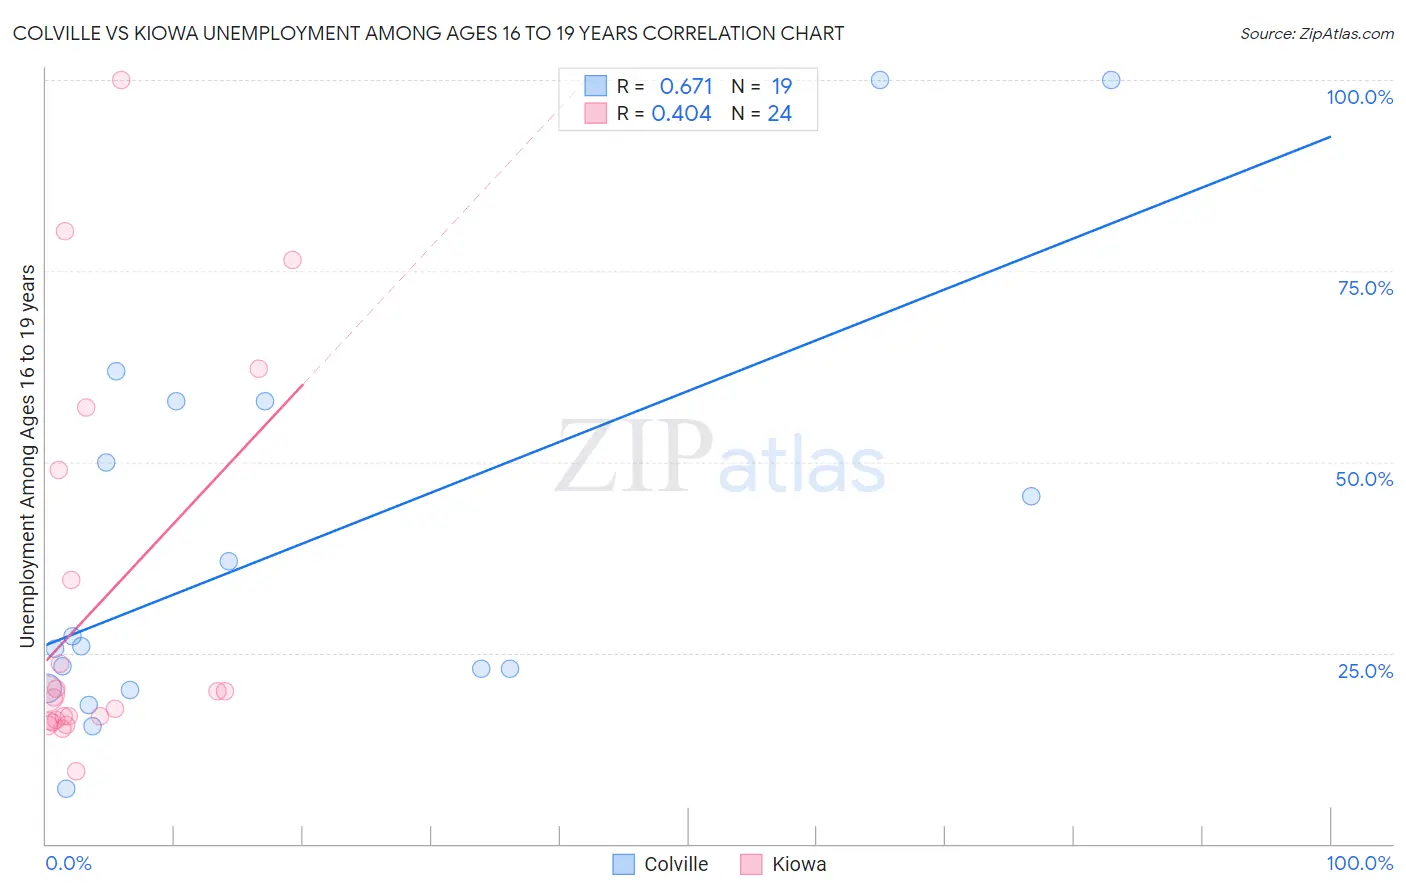
Colville vs Kiowa Unemployment Among Ages 16 to 19 years Correlation Chart
The statistical analysis conducted on geographies consisting of 34,302,836 people shows a significant positive correlation between the proportion of Colville and unemployment rate among population between the ages 16 and 19 in the United States with a correlation coefficient (R) of 0.671 and weighted average of 29.7%. Similarly, the statistical analysis conducted on geographies consisting of 55,446,259 people shows a moderate positive correlation between the proportion of Kiowa and unemployment rate among population between the ages 16 and 19 in the United States with a correlation coefficient (R) of 0.404 and weighted average of 25.2%, a difference of 17.7%.
Unemployment Among Ages 16 to 19 years Correlation Summary
| Measurement | Colville | Kiowa |
| Minimum | 7.1% | 9.5% |
| Maximum | 100.0% | 100.0% |
| Range | 92.9% | 90.5% |
| Mean | 38.9% | 31.4% |
| Median | 25.9% | 19.4% |
| Interquartile 25% (IQ1) | 20.3% | 16.1% |
| Interquartile 75% (IQ3) | 57.9% | 41.7% |
| Interquartile Range (IQR) | 37.6% | 25.6% |
| Standard Deviation (Sample) | 26.7% | 25.2% |
| Standard Deviation (Population) | 26.0% | 24.6% |
Demographics Similar to Colville and Kiowa by Unemployment Among Ages 16 to 19 years
In terms of unemployment among ages 16 to 19 years, the demographic groups most similar to Colville are Navajo (29.0%, a difference of 2.2%), Hopi (30.7%, a difference of 3.3%), Inupiat (28.1%, a difference of 5.8%), Puerto Rican (27.5%, a difference of 7.9%), and Crow (26.2%, a difference of 13.1%). Similarly, the demographic groups most similar to Kiowa are Arapaho (25.2%, a difference of 0.21%), Immigrants from Guyana (25.5%, a difference of 1.1%), Guyanese (24.8%, a difference of 1.5%), Immigrants from St. Vincent and the Grenadines (25.7%, a difference of 1.9%), and Immigrants from Grenada (25.7%, a difference of 2.1%).
| Demographics | Rating | Rank | Unemployment Among Ages 16 to 19 years |
| Immigrants | Dominican Republic | 0.0 /100 | #328 | Tragic 23.3% |
| Tlingit-Haida | 0.0 /100 | #329 | Tragic 23.5% |
| Dominicans | 0.0 /100 | #330 | Tragic 23.6% |
| British West Indians | 0.0 /100 | #331 | Tragic 24.0% |
| Immigrants | Barbados | 0.0 /100 | #332 | Tragic 24.0% |
| Paiute | 0.0 /100 | #333 | Tragic 24.4% |
| Guyanese | 0.0 /100 | #334 | Tragic 24.8% |
| Arapaho | 0.0 /100 | #335 | Tragic 25.2% |
| Kiowa | 0.0 /100 | #336 | Tragic 25.2% |
| Immigrants | Guyana | 0.0 /100 | #337 | Tragic 25.5% |
| Immigrants | St. Vincent and the Grenadines | 0.0 /100 | #338 | Tragic 25.7% |
| Immigrants | Grenada | 0.0 /100 | #339 | Tragic 25.7% |
| Crow | 0.0 /100 | #340 | Tragic 26.2% |
| Puerto Ricans | 0.0 /100 | #341 | Tragic 27.5% |
| Inupiat | 0.0 /100 | #342 | Tragic 28.1% |
| Navajo | 0.0 /100 | #343 | Tragic 29.0% |
| Colville | 0.0 /100 | #344 | Tragic 29.7% |
| Hopi | 0.0 /100 | #345 | Tragic 30.7% |
| Yuman | 0.0 /100 | #346 | Tragic 37.4% |
| Yup'ik | 0.0 /100 | #347 | Tragic 41.0% |