Colville vs Immigrants from Bangladesh Family Poverty
COMPARE
Colville
Immigrants from Bangladesh
Family Poverty
Family Poverty Comparison
Colville
Immigrants from Bangladesh
13.0%
FAMILY POVERTY
0.0/ 100
METRIC RATING
326th/ 347
METRIC RANK
11.7%
FAMILY POVERTY
0.0/ 100
METRIC RATING
300th/ 347
METRIC RANK
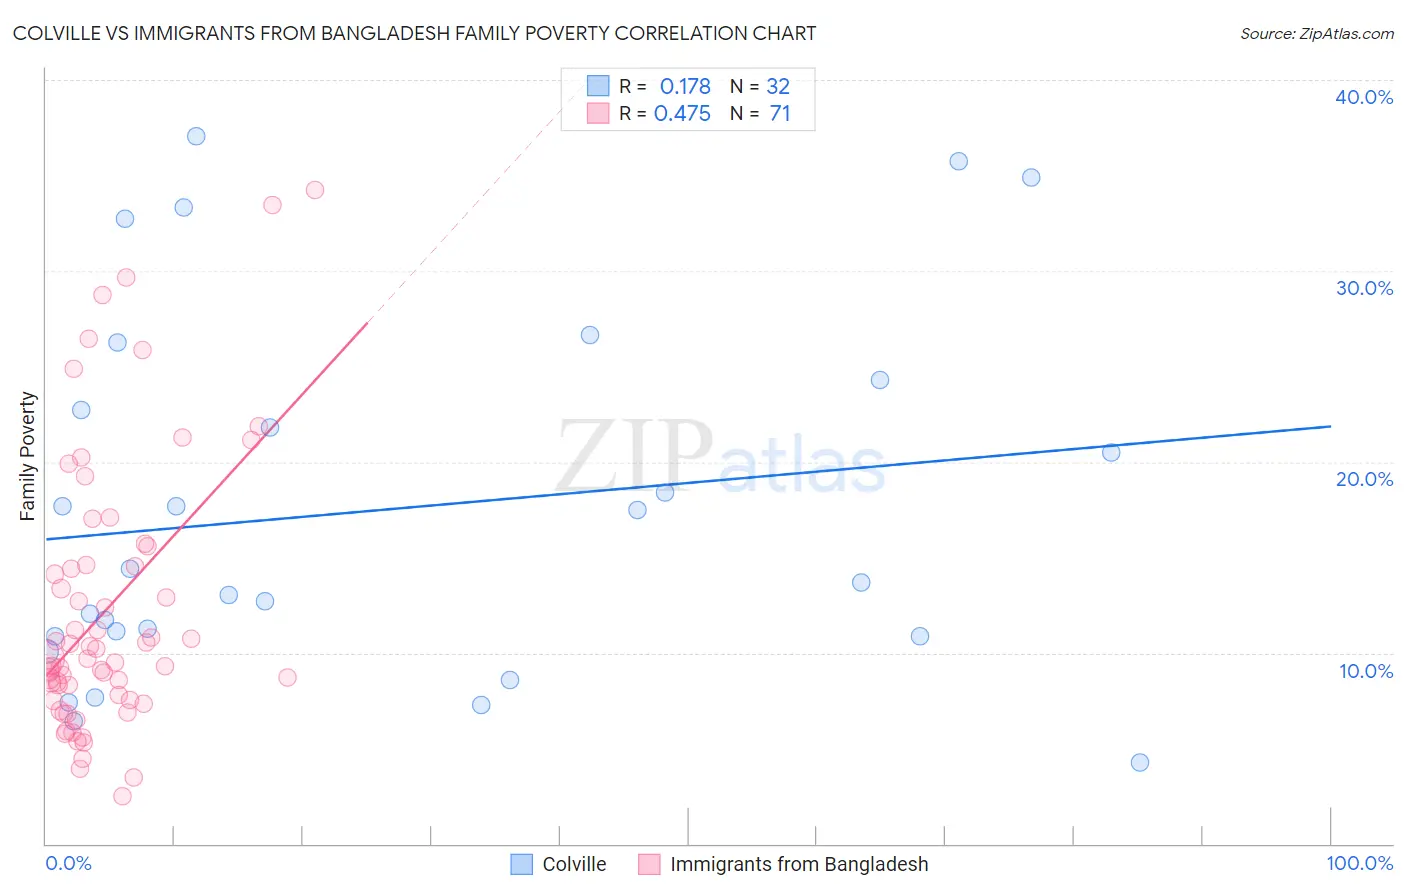
Colville vs Immigrants from Bangladesh Family Poverty Correlation Chart
The statistical analysis conducted on geographies consisting of 34,676,230 people shows a poor positive correlation between the proportion of Colville and poverty level among families in the United States with a correlation coefficient (R) of 0.178 and weighted average of 13.0%. Similarly, the statistical analysis conducted on geographies consisting of 203,403,865 people shows a moderate positive correlation between the proportion of Immigrants from Bangladesh and poverty level among families in the United States with a correlation coefficient (R) of 0.475 and weighted average of 11.7%, a difference of 11.3%.
Family Poverty Correlation Summary
| Measurement | Colville | Immigrants from Bangladesh |
| Minimum | 4.3% | 2.5% |
| Maximum | 37.1% | 34.2% |
| Range | 32.8% | 31.7% |
| Mean | 17.5% | 12.3% |
| Median | 14.0% | 9.7% |
| Interquartile 25% (IQ1) | 10.9% | 7.5% |
| Interquartile 75% (IQ3) | 23.5% | 14.6% |
| Interquartile Range (IQR) | 12.6% | 7.1% |
| Standard Deviation (Sample) | 9.5% | 7.2% |
| Standard Deviation (Population) | 9.3% | 7.1% |
Similar Demographics by Family Poverty
Demographics Similar to Colville by Family Poverty
In terms of family poverty, the demographic groups most similar to Colville are Paiute (13.0%, a difference of 0.060%), Yakama (13.1%, a difference of 0.68%), Immigrants from Dominica (12.7%, a difference of 2.0%), Menominee (12.7%, a difference of 2.1%), and Central American Indian (13.3%, a difference of 2.4%).
| Demographics | Rating | Rank | Family Poverty |
| British West Indians | 0.0 /100 | #319 | Tragic 12.4% |
| Inupiat | 0.0 /100 | #320 | Tragic 12.5% |
| Arapaho | 0.0 /100 | #321 | Tragic 12.7% |
| Immigrants | Honduras | 0.0 /100 | #322 | Tragic 12.7% |
| Menominee | 0.0 /100 | #323 | Tragic 12.7% |
| Immigrants | Dominica | 0.0 /100 | #324 | Tragic 12.7% |
| Paiute | 0.0 /100 | #325 | Tragic 13.0% |
| Colville | 0.0 /100 | #326 | Tragic 13.0% |
| Yakama | 0.0 /100 | #327 | Tragic 13.1% |
| Central American Indians | 0.0 /100 | #328 | Tragic 13.3% |
| Blacks/African Americans | 0.0 /100 | #329 | Tragic 13.3% |
| Natives/Alaskans | 0.0 /100 | #330 | Tragic 14.3% |
| Cheyenne | 0.0 /100 | #331 | Tragic 14.3% |
| Dominicans | 0.0 /100 | #332 | Tragic 14.3% |
| Immigrants | Dominican Republic | 0.0 /100 | #333 | Tragic 14.4% |
Demographics Similar to Immigrants from Bangladesh by Family Poverty
In terms of family poverty, the demographic groups most similar to Immigrants from Bangladesh are Dutch West Indian (11.7%, a difference of 0.010%), Immigrants from Senegal (11.7%, a difference of 0.11%), Creek (11.7%, a difference of 0.25%), Bahamian (11.7%, a difference of 0.25%), and Guatemalan (11.7%, a difference of 0.29%).
| Demographics | Rating | Rank | Family Poverty |
| Immigrants | Cabo Verde | 0.0 /100 | #293 | Tragic 11.6% |
| Immigrants | St. Vincent and the Grenadines | 0.0 /100 | #294 | Tragic 11.6% |
| Immigrants | Haiti | 0.0 /100 | #295 | Tragic 11.6% |
| Choctaw | 0.0 /100 | #296 | Tragic 11.6% |
| Creek | 0.0 /100 | #297 | Tragic 11.7% |
| Immigrants | Senegal | 0.0 /100 | #298 | Tragic 11.7% |
| Dutch West Indians | 0.0 /100 | #299 | Tragic 11.7% |
| Immigrants | Bangladesh | 0.0 /100 | #300 | Tragic 11.7% |
| Bahamians | 0.0 /100 | #301 | Tragic 11.7% |
| Guatemalans | 0.0 /100 | #302 | Tragic 11.7% |
| Africans | 0.0 /100 | #303 | Tragic 11.8% |
| Immigrants | Latin America | 0.0 /100 | #304 | Tragic 11.8% |
| Mexicans | 0.0 /100 | #305 | Tragic 11.8% |
| Cajuns | 0.0 /100 | #306 | Tragic 11.9% |
| Immigrants | Congo | 0.0 /100 | #307 | Tragic 11.9% |