Choctaw vs Immigrants from Greece Female Poverty
COMPARE
Choctaw
Immigrants from Greece
Female Poverty
Female Poverty Comparison
Choctaw
Immigrants from Greece
16.8%
FEMALE POVERTY
0.0/ 100
METRIC RATING
303rd/ 347
METRIC RANK
11.8%
FEMALE POVERTY
99.3/ 100
METRIC RATING
37th/ 347
METRIC RANK
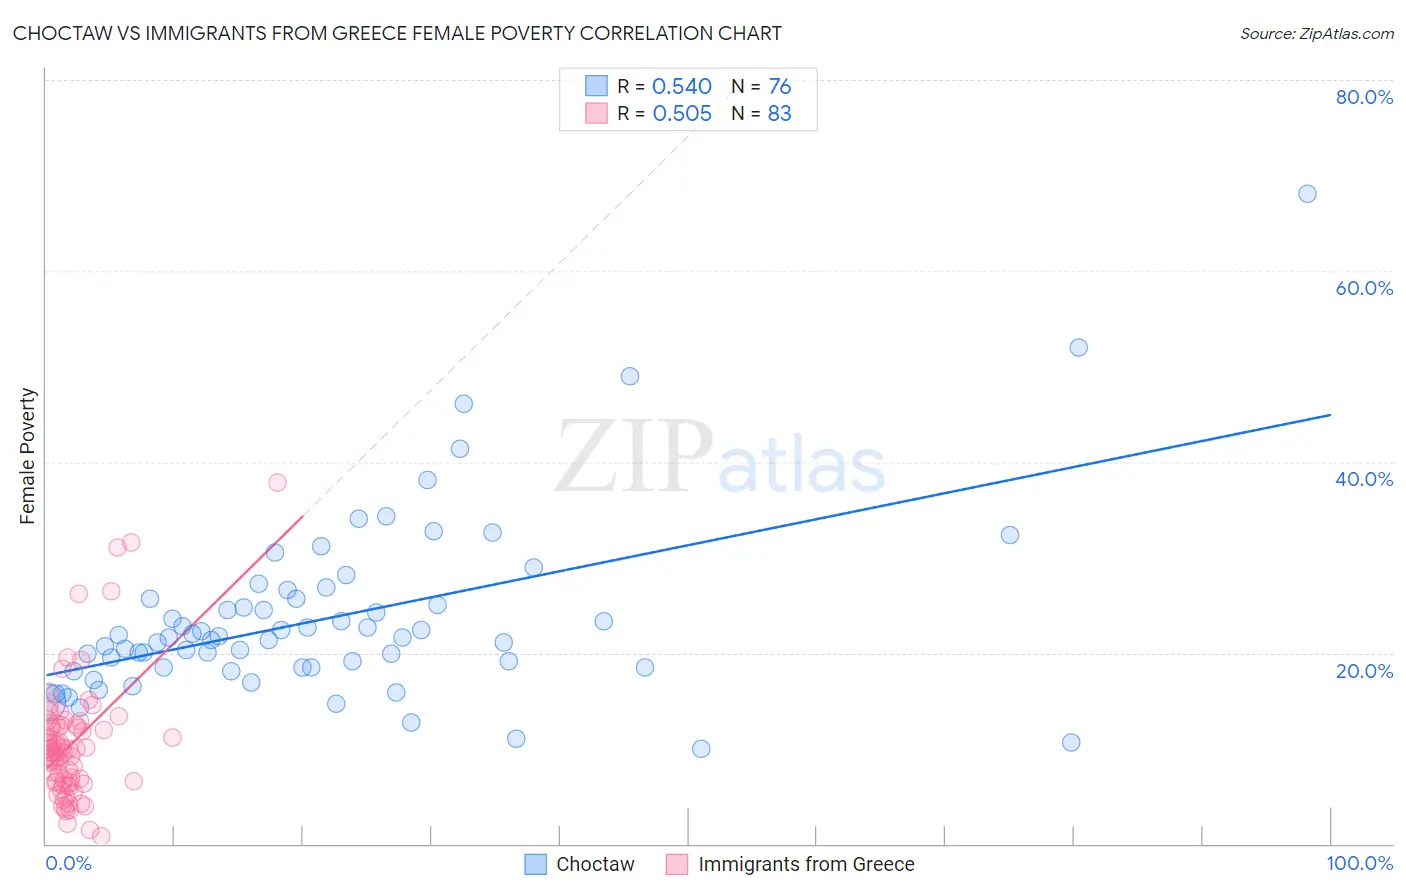
Choctaw vs Immigrants from Greece Female Poverty Correlation Chart
The statistical analysis conducted on geographies consisting of 269,592,766 people shows a substantial positive correlation between the proportion of Choctaw and poverty level among females in the United States with a correlation coefficient (R) of 0.540 and weighted average of 16.8%. Similarly, the statistical analysis conducted on geographies consisting of 216,839,039 people shows a substantial positive correlation between the proportion of Immigrants from Greece and poverty level among females in the United States with a correlation coefficient (R) of 0.505 and weighted average of 11.8%, a difference of 42.2%.
Female Poverty Correlation Summary
| Measurement | Choctaw | Immigrants from Greece |
| Minimum | 10.0% | 0.85% |
| Maximum | 68.1% | 37.8% |
| Range | 58.1% | 37.0% |
| Mean | 23.7% | 10.5% |
| Median | 21.6% | 9.9% |
| Interquartile 25% (IQ1) | 18.4% | 6.5% |
| Interquartile 75% (IQ3) | 25.6% | 12.5% |
| Interquartile Range (IQR) | 7.2% | 6.0% |
| Standard Deviation (Sample) | 9.5% | 6.5% |
| Standard Deviation (Population) | 9.5% | 6.4% |
Similar Demographics by Female Poverty
Demographics Similar to Choctaw by Female Poverty
In terms of female poverty, the demographic groups most similar to Choctaw are Immigrants from Central America (16.8%, a difference of 0.060%), Immigrants from Grenada (16.8%, a difference of 0.070%), Immigrants from Caribbean (16.9%, a difference of 0.33%), Seminole (16.9%, a difference of 0.46%), and African (16.9%, a difference of 0.52%).
| Demographics | Rating | Rank | Female Poverty |
| Immigrants | Senegal | 0.0 /100 | #296 | Tragic 16.5% |
| Mexicans | 0.0 /100 | #297 | Tragic 16.5% |
| Somalis | 0.0 /100 | #298 | Tragic 16.6% |
| Hispanics or Latinos | 0.0 /100 | #299 | Tragic 16.6% |
| Bahamians | 0.0 /100 | #300 | Tragic 16.6% |
| Guatemalans | 0.0 /100 | #301 | Tragic 16.7% |
| Chippewa | 0.0 /100 | #302 | Tragic 16.7% |
| Choctaw | 0.0 /100 | #303 | Tragic 16.8% |
| Immigrants | Central America | 0.0 /100 | #304 | Tragic 16.8% |
| Immigrants | Grenada | 0.0 /100 | #305 | Tragic 16.8% |
| Immigrants | Caribbean | 0.0 /100 | #306 | Tragic 16.9% |
| Seminole | 0.0 /100 | #307 | Tragic 16.9% |
| Africans | 0.0 /100 | #308 | Tragic 16.9% |
| Immigrants | Mexico | 0.0 /100 | #309 | Tragic 17.0% |
| Creek | 0.0 /100 | #310 | Tragic 17.0% |
Demographics Similar to Immigrants from Greece by Female Poverty
In terms of female poverty, the demographic groups most similar to Immigrants from Greece are Russian (11.8%, a difference of 0.020%), Immigrants from Pakistan (11.8%, a difference of 0.10%), Immigrants from Poland (11.8%, a difference of 0.22%), Immigrants from Iran (11.8%, a difference of 0.27%), and Macedonian (11.8%, a difference of 0.27%).
| Demographics | Rating | Rank | Female Poverty |
| Greeks | 99.5 /100 | #30 | Exceptional 11.7% |
| Poles | 99.5 /100 | #31 | Exceptional 11.7% |
| Danes | 99.5 /100 | #32 | Exceptional 11.7% |
| Cypriots | 99.5 /100 | #33 | Exceptional 11.8% |
| Immigrants | Singapore | 99.4 /100 | #34 | Exceptional 11.8% |
| Immigrants | Iran | 99.4 /100 | #35 | Exceptional 11.8% |
| Immigrants | Pakistan | 99.4 /100 | #36 | Exceptional 11.8% |
| Immigrants | Greece | 99.3 /100 | #37 | Exceptional 11.8% |
| Russians | 99.3 /100 | #38 | Exceptional 11.8% |
| Immigrants | Poland | 99.3 /100 | #39 | Exceptional 11.8% |
| Macedonians | 99.3 /100 | #40 | Exceptional 11.8% |
| Czechs | 99.2 /100 | #41 | Exceptional 11.9% |
| Immigrants | Moldova | 99.2 /100 | #42 | Exceptional 11.9% |
| Koreans | 99.2 /100 | #43 | Exceptional 11.9% |
| Tongans | 99.2 /100 | #44 | Exceptional 11.9% |