Choctaw vs Honduran Female Poverty
COMPARE
Choctaw
Honduran
Female Poverty
Female Poverty Comparison
Choctaw
Hondurans
16.8%
FEMALE POVERTY
0.0/ 100
METRIC RATING
303rd/ 347
METRIC RANK
17.4%
FEMALE POVERTY
0.0/ 100
METRIC RATING
316th/ 347
METRIC RANK
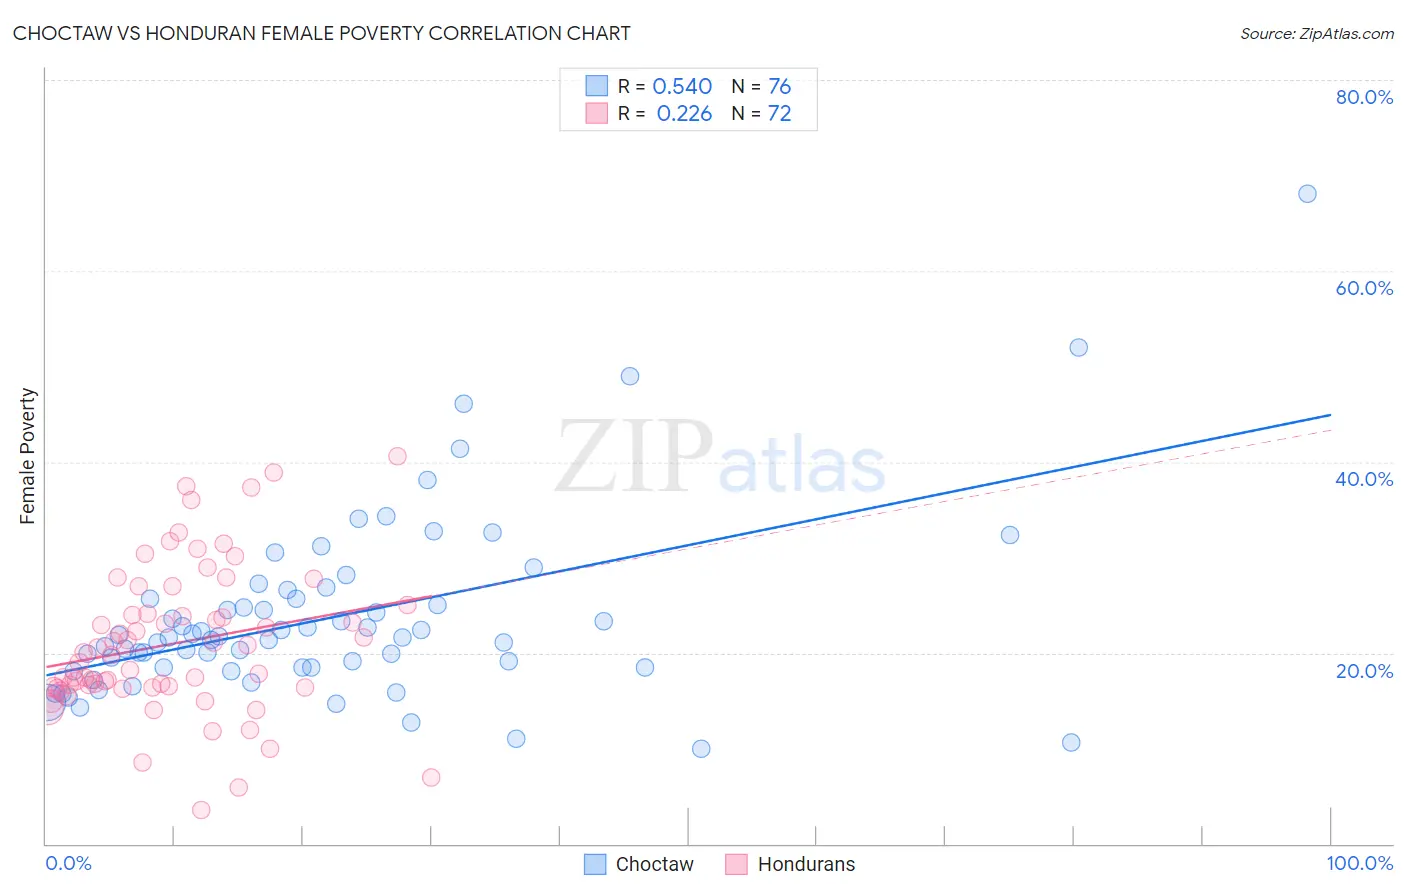
Choctaw vs Honduran Female Poverty Correlation Chart
The statistical analysis conducted on geographies consisting of 269,592,766 people shows a substantial positive correlation between the proportion of Choctaw and poverty level among females in the United States with a correlation coefficient (R) of 0.540 and weighted average of 16.8%. Similarly, the statistical analysis conducted on geographies consisting of 357,544,045 people shows a weak positive correlation between the proportion of Hondurans and poverty level among females in the United States with a correlation coefficient (R) of 0.226 and weighted average of 17.4%, a difference of 3.3%.
Female Poverty Correlation Summary
| Measurement | Choctaw | Honduran |
| Minimum | 10.0% | 3.6% |
| Maximum | 68.1% | 40.6% |
| Range | 58.1% | 37.0% |
| Mean | 23.7% | 21.0% |
| Median | 21.6% | 20.0% |
| Interquartile 25% (IQ1) | 18.4% | 16.4% |
| Interquartile 75% (IQ3) | 25.6% | 24.5% |
| Interquartile Range (IQR) | 7.2% | 8.1% |
| Standard Deviation (Sample) | 9.5% | 7.7% |
| Standard Deviation (Population) | 9.5% | 7.7% |
Demographics Similar to Choctaw and Hondurans by Female Poverty
In terms of female poverty, the demographic groups most similar to Choctaw are Immigrants from Central America (16.8%, a difference of 0.060%), Immigrants from Grenada (16.8%, a difference of 0.070%), Immigrants from Caribbean (16.9%, a difference of 0.33%), Seminole (16.9%, a difference of 0.46%), and African (16.9%, a difference of 0.52%). Similarly, the demographic groups most similar to Hondurans are Immigrants from Congo (17.4%, a difference of 0.19%), U.S. Virgin Islander (17.3%, a difference of 0.30%), Ute (17.5%, a difference of 0.52%), Cajun (17.5%, a difference of 0.53%), and Dutch West Indian (17.1%, a difference of 1.7%).
| Demographics | Rating | Rank | Female Poverty |
| Hispanics or Latinos | 0.0 /100 | #299 | Tragic 16.6% |
| Bahamians | 0.0 /100 | #300 | Tragic 16.6% |
| Guatemalans | 0.0 /100 | #301 | Tragic 16.7% |
| Chippewa | 0.0 /100 | #302 | Tragic 16.7% |
| Choctaw | 0.0 /100 | #303 | Tragic 16.8% |
| Immigrants | Central America | 0.0 /100 | #304 | Tragic 16.8% |
| Immigrants | Grenada | 0.0 /100 | #305 | Tragic 16.8% |
| Immigrants | Caribbean | 0.0 /100 | #306 | Tragic 16.9% |
| Seminole | 0.0 /100 | #307 | Tragic 16.9% |
| Africans | 0.0 /100 | #308 | Tragic 16.9% |
| Immigrants | Mexico | 0.0 /100 | #309 | Tragic 17.0% |
| Creek | 0.0 /100 | #310 | Tragic 17.0% |
| Immigrants | Guatemala | 0.0 /100 | #311 | Tragic 17.0% |
| Immigrants | Somalia | 0.0 /100 | #312 | Tragic 17.0% |
| British West Indians | 0.0 /100 | #313 | Tragic 17.0% |
| Dutch West Indians | 0.0 /100 | #314 | Tragic 17.1% |
| U.S. Virgin Islanders | 0.0 /100 | #315 | Tragic 17.3% |
| Hondurans | 0.0 /100 | #316 | Tragic 17.4% |
| Immigrants | Congo | 0.0 /100 | #317 | Tragic 17.4% |
| Ute | 0.0 /100 | #318 | Tragic 17.5% |
| Cajuns | 0.0 /100 | #319 | Tragic 17.5% |