Chippewa vs Immigrants from Western Africa Single Mother Poverty
COMPARE
Chippewa
Immigrants from Western Africa
Single Mother Poverty
Single Mother Poverty Comparison
Chippewa
Immigrants from Western Africa
34.8%
SINGLE MOTHER POVERTY
0.0/ 100
METRIC RATING
319th/ 347
METRIC RANK
29.9%
SINGLE MOTHER POVERTY
11.5/ 100
METRIC RATING
216th/ 347
METRIC RANK
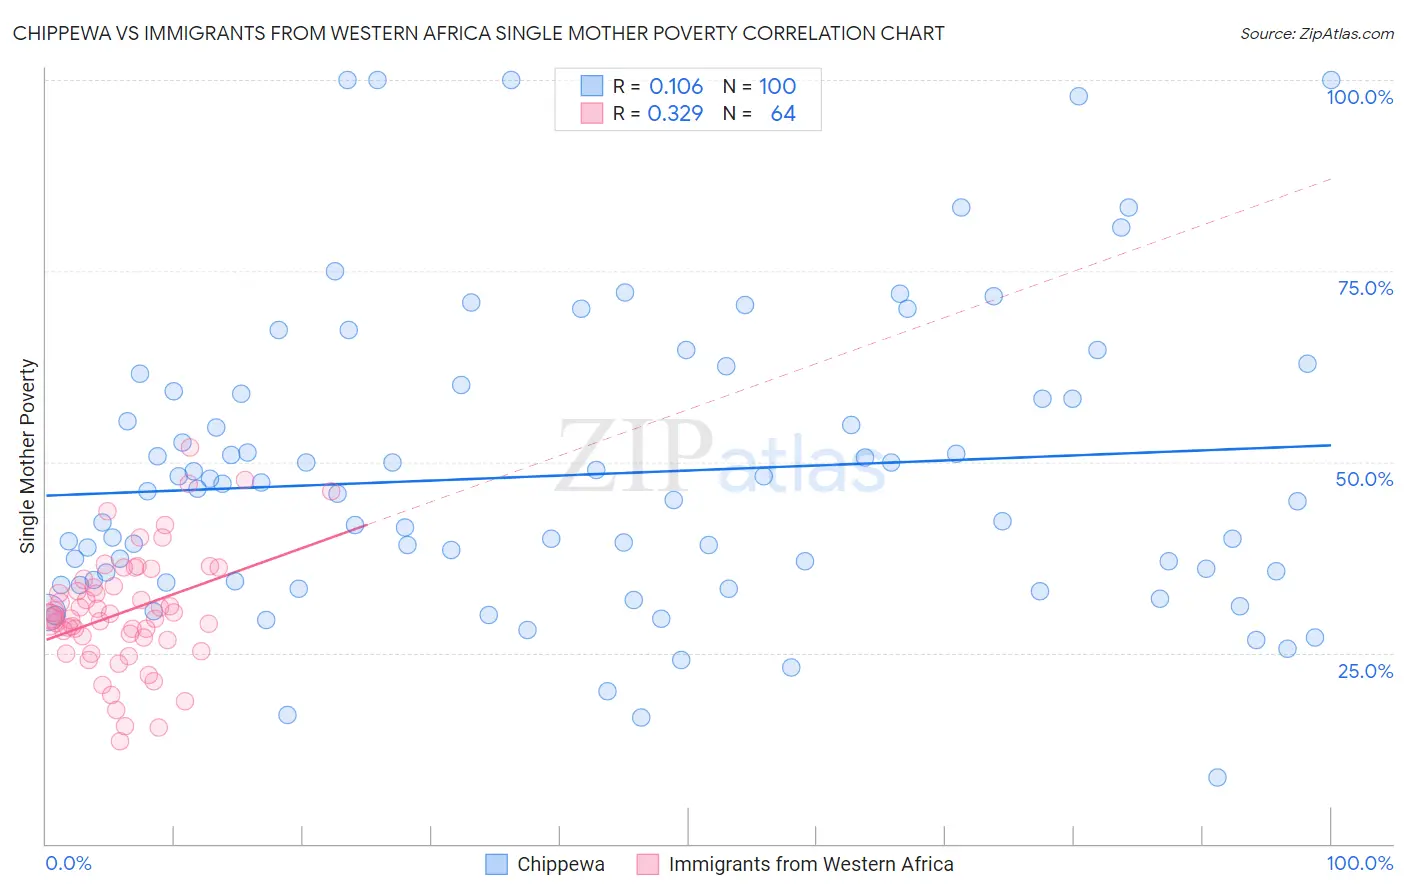
Chippewa vs Immigrants from Western Africa Single Mother Poverty Correlation Chart
The statistical analysis conducted on geographies consisting of 212,048,110 people shows a poor positive correlation between the proportion of Chippewa and poverty level among single mothers in the United States with a correlation coefficient (R) of 0.106 and weighted average of 34.8%. Similarly, the statistical analysis conducted on geographies consisting of 351,716,965 people shows a mild positive correlation between the proportion of Immigrants from Western Africa and poverty level among single mothers in the United States with a correlation coefficient (R) of 0.329 and weighted average of 29.9%, a difference of 16.4%.
Single Mother Poverty Correlation Summary
| Measurement | Chippewa | Immigrants from Western Africa |
| Minimum | 8.7% | 13.4% |
| Maximum | 100.0% | 51.8% |
| Range | 91.3% | 38.4% |
| Mean | 48.3% | 30.4% |
| Median | 45.4% | 29.6% |
| Interquartile 25% (IQ1) | 34.3% | 26.8% |
| Interquartile 75% (IQ3) | 59.1% | 34.1% |
| Interquartile Range (IQR) | 24.8% | 7.3% |
| Standard Deviation (Sample) | 19.5% | 7.7% |
| Standard Deviation (Population) | 19.4% | 7.7% |
Similar Demographics by Single Mother Poverty
Demographics Similar to Chippewa by Single Mother Poverty
In terms of single mother poverty, the demographic groups most similar to Chippewa are Immigrants from Honduras (34.7%, a difference of 0.15%), Iroquois (34.8%, a difference of 0.24%), Cherokee (34.5%, a difference of 0.67%), Dominican (34.5%, a difference of 0.78%), and Hopi (34.5%, a difference of 0.90%).
| Demographics | Rating | Rank | Single Mother Poverty |
| Central American Indians | 0.0 /100 | #312 | Tragic 34.3% |
| Immigrants | Dominican Republic | 0.0 /100 | #313 | Tragic 34.4% |
| Chickasaw | 0.0 /100 | #314 | Tragic 34.4% |
| Hopi | 0.0 /100 | #315 | Tragic 34.5% |
| Dominicans | 0.0 /100 | #316 | Tragic 34.5% |
| Cherokee | 0.0 /100 | #317 | Tragic 34.5% |
| Immigrants | Honduras | 0.0 /100 | #318 | Tragic 34.7% |
| Chippewa | 0.0 /100 | #319 | Tragic 34.8% |
| Iroquois | 0.0 /100 | #320 | Tragic 34.8% |
| Paiute | 0.0 /100 | #321 | Tragic 35.1% |
| Blacks/African Americans | 0.0 /100 | #322 | Tragic 35.2% |
| Kiowa | 0.0 /100 | #323 | Tragic 35.5% |
| Ottawa | 0.0 /100 | #324 | Tragic 35.5% |
| Ute | 0.0 /100 | #325 | Tragic 35.7% |
| Seminole | 0.0 /100 | #326 | Tragic 35.8% |
Demographics Similar to Immigrants from Western Africa by Single Mother Poverty
In terms of single mother poverty, the demographic groups most similar to Immigrants from Western Africa are Liberian (29.9%, a difference of 0.020%), Jamaican (29.9%, a difference of 0.020%), Immigrants from Ghana (29.9%, a difference of 0.030%), Immigrants from Thailand (29.9%, a difference of 0.050%), and Nicaraguan (29.8%, a difference of 0.10%).
| Demographics | Rating | Rank | Single Mother Poverty |
| Irish | 13.9 /100 | #209 | Poor 29.8% |
| Haitians | 13.3 /100 | #210 | Poor 29.8% |
| Guyanese | 12.8 /100 | #211 | Poor 29.8% |
| Nicaraguans | 12.4 /100 | #212 | Poor 29.8% |
| Immigrants | Thailand | 12.0 /100 | #213 | Poor 29.9% |
| Liberians | 11.7 /100 | #214 | Poor 29.9% |
| Jamaicans | 11.7 /100 | #215 | Poor 29.9% |
| Immigrants | Western Africa | 11.5 /100 | #216 | Poor 29.9% |
| Immigrants | Ghana | 11.3 /100 | #217 | Poor 29.9% |
| Hungarians | 10.3 /100 | #218 | Poor 29.9% |
| Finns | 9.3 /100 | #219 | Tragic 30.0% |
| Germans | 8.8 /100 | #220 | Tragic 30.0% |
| Immigrants | Eritrea | 7.7 /100 | #221 | Tragic 30.0% |
| Sudanese | 7.6 /100 | #222 | Tragic 30.0% |
| Immigrants | Cuba | 6.9 /100 | #223 | Tragic 30.1% |