Immigrants from Middle Africa vs Immigrants from Western Africa Single Mother Poverty
COMPARE
Immigrants from Middle Africa
Immigrants from Western Africa
Single Mother Poverty
Single Mother Poverty Comparison
Immigrants from Middle Africa
Immigrants from Western Africa
30.3%
SINGLE MOTHER POVERTY
3.5/ 100
METRIC RATING
233rd/ 347
METRIC RANK
29.9%
SINGLE MOTHER POVERTY
11.5/ 100
METRIC RATING
216th/ 347
METRIC RANK
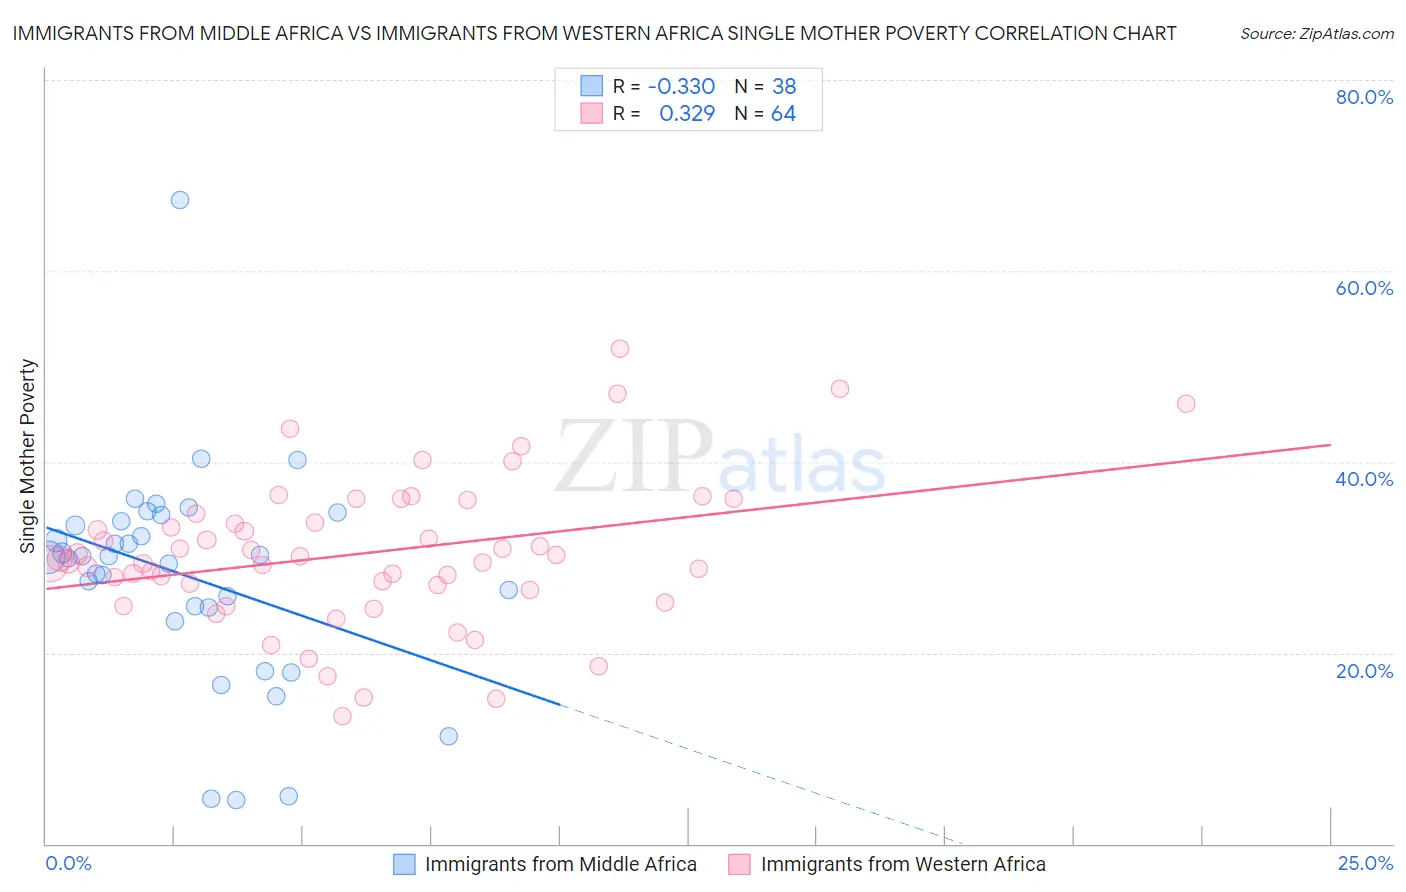
Immigrants from Middle Africa vs Immigrants from Western Africa Single Mother Poverty Correlation Chart
The statistical analysis conducted on geographies consisting of 200,673,023 people shows a mild negative correlation between the proportion of Immigrants from Middle Africa and poverty level among single mothers in the United States with a correlation coefficient (R) of -0.330 and weighted average of 30.3%. Similarly, the statistical analysis conducted on geographies consisting of 351,716,965 people shows a mild positive correlation between the proportion of Immigrants from Western Africa and poverty level among single mothers in the United States with a correlation coefficient (R) of 0.329 and weighted average of 29.9%, a difference of 1.5%.
Single Mother Poverty Correlation Summary
| Measurement | Immigrants from Middle Africa | Immigrants from Western Africa |
| Minimum | 4.5% | 13.4% |
| Maximum | 67.4% | 51.8% |
| Range | 62.9% | 38.4% |
| Mean | 28.1% | 30.4% |
| Median | 30.0% | 29.6% |
| Interquartile 25% (IQ1) | 24.8% | 26.8% |
| Interquartile 75% (IQ3) | 33.8% | 34.1% |
| Interquartile Range (IQR) | 9.0% | 7.3% |
| Standard Deviation (Sample) | 11.3% | 7.7% |
| Standard Deviation (Population) | 11.2% | 7.7% |
Demographics Similar to Immigrants from Middle Africa and Immigrants from Western Africa by Single Mother Poverty
In terms of single mother poverty, the demographic groups most similar to Immigrants from Middle Africa are Immigrants from Nicaragua (30.3%, a difference of 0.0%), Alaskan Athabascan (30.3%, a difference of 0.21%), Dutch (30.2%, a difference of 0.25%), English (30.2%, a difference of 0.40%), and Immigrants from Barbados (30.2%, a difference of 0.44%). Similarly, the demographic groups most similar to Immigrants from Western Africa are Liberian (29.9%, a difference of 0.020%), Jamaican (29.9%, a difference of 0.020%), Immigrants from Ghana (29.9%, a difference of 0.030%), Hungarian (29.9%, a difference of 0.14%), and Finnish (30.0%, a difference of 0.28%).
| Demographics | Rating | Rank | Single Mother Poverty |
| Liberians | 11.7 /100 | #214 | Poor 29.9% |
| Jamaicans | 11.7 /100 | #215 | Poor 29.9% |
| Immigrants | Western Africa | 11.5 /100 | #216 | Poor 29.9% |
| Immigrants | Ghana | 11.3 /100 | #217 | Poor 29.9% |
| Hungarians | 10.3 /100 | #218 | Poor 29.9% |
| Finns | 9.3 /100 | #219 | Tragic 30.0% |
| Germans | 8.8 /100 | #220 | Tragic 30.0% |
| Immigrants | Eritrea | 7.7 /100 | #221 | Tragic 30.0% |
| Sudanese | 7.6 /100 | #222 | Tragic 30.0% |
| Immigrants | Cuba | 6.9 /100 | #223 | Tragic 30.1% |
| Immigrants | Sudan | 6.5 /100 | #224 | Tragic 30.1% |
| Spanish | 6.3 /100 | #225 | Tragic 30.1% |
| Scottish | 6.0 /100 | #226 | Tragic 30.1% |
| Immigrants | Liberia | 5.9 /100 | #227 | Tragic 30.1% |
| Spaniards | 5.4 /100 | #228 | Tragic 30.2% |
| Immigrants | Barbados | 5.0 /100 | #229 | Tragic 30.2% |
| English | 4.8 /100 | #230 | Tragic 30.2% |
| Dutch | 4.3 /100 | #231 | Tragic 30.2% |
| Alaskan Athabascans | 4.1 /100 | #232 | Tragic 30.3% |
| Immigrants | Middle Africa | 3.5 /100 | #233 | Tragic 30.3% |
| Immigrants | Nicaragua | 3.5 /100 | #234 | Tragic 30.3% |