Immigrants from Asia vs Immigrants from Western Africa Single Mother Poverty
COMPARE
Immigrants from Asia
Immigrants from Western Africa
Single Mother Poverty
Single Mother Poverty Comparison
Immigrants from Asia
Immigrants from Western Africa
26.3%
SINGLE MOTHER POVERTY
100.0/ 100
METRIC RATING
25th/ 347
METRIC RANK
29.9%
SINGLE MOTHER POVERTY
11.5/ 100
METRIC RATING
216th/ 347
METRIC RANK
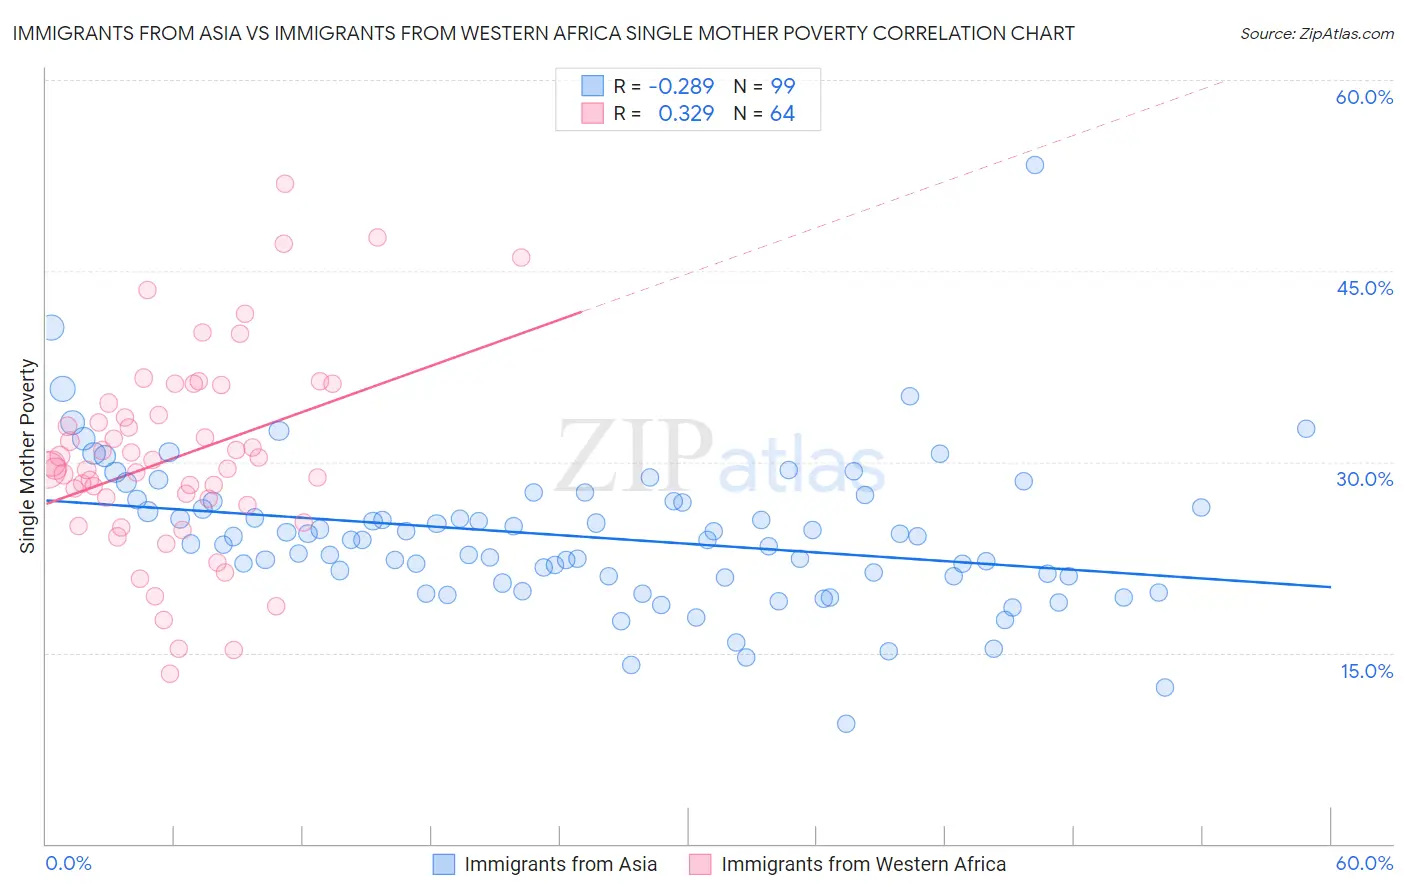
Immigrants from Asia vs Immigrants from Western Africa Single Mother Poverty Correlation Chart
The statistical analysis conducted on geographies consisting of 525,815,125 people shows a weak negative correlation between the proportion of Immigrants from Asia and poverty level among single mothers in the United States with a correlation coefficient (R) of -0.289 and weighted average of 26.3%. Similarly, the statistical analysis conducted on geographies consisting of 351,716,965 people shows a mild positive correlation between the proportion of Immigrants from Western Africa and poverty level among single mothers in the United States with a correlation coefficient (R) of 0.329 and weighted average of 29.9%, a difference of 13.6%.
Single Mother Poverty Correlation Summary
| Measurement | Immigrants from Asia | Immigrants from Western Africa |
| Minimum | 9.5% | 13.4% |
| Maximum | 53.3% | 51.8% |
| Range | 43.9% | 38.4% |
| Mean | 24.1% | 30.4% |
| Median | 23.9% | 29.6% |
| Interquartile 25% (IQ1) | 21.0% | 26.8% |
| Interquartile 75% (IQ3) | 26.9% | 34.1% |
| Interquartile Range (IQR) | 5.9% | 7.3% |
| Standard Deviation (Sample) | 5.9% | 7.7% |
| Standard Deviation (Population) | 5.9% | 7.7% |
Similar Demographics by Single Mother Poverty
Demographics Similar to Immigrants from Asia by Single Mother Poverty
In terms of single mother poverty, the demographic groups most similar to Immigrants from Asia are Immigrants from Sri Lanka (26.3%, a difference of 0.13%), Immigrants from Moldova (26.2%, a difference of 0.19%), Burmese (26.2%, a difference of 0.22%), Immigrants from Japan (26.4%, a difference of 0.36%), and Korean (26.4%, a difference of 0.37%).
| Demographics | Rating | Rank | Single Mother Poverty |
| Immigrants | Pakistan | 100.0 /100 | #18 | Exceptional 26.0% |
| Immigrants | Eastern Asia | 100.0 /100 | #19 | Exceptional 26.1% |
| Immigrants | China | 100.0 /100 | #20 | Exceptional 26.1% |
| Immigrants | Bolivia | 100.0 /100 | #21 | Exceptional 26.2% |
| Immigrants | Korea | 100.0 /100 | #22 | Exceptional 26.2% |
| Burmese | 100.0 /100 | #23 | Exceptional 26.2% |
| Immigrants | Moldova | 100.0 /100 | #24 | Exceptional 26.2% |
| Immigrants | Asia | 100.0 /100 | #25 | Exceptional 26.3% |
| Immigrants | Sri Lanka | 100.0 /100 | #26 | Exceptional 26.3% |
| Immigrants | Japan | 100.0 /100 | #27 | Exceptional 26.4% |
| Koreans | 100.0 /100 | #28 | Exceptional 26.4% |
| Jordanians | 100.0 /100 | #29 | Exceptional 26.4% |
| Turks | 100.0 /100 | #30 | Exceptional 26.4% |
| Immigrants | Philippines | 100.0 /100 | #31 | Exceptional 26.5% |
| Tongans | 99.9 /100 | #32 | Exceptional 26.5% |
Demographics Similar to Immigrants from Western Africa by Single Mother Poverty
In terms of single mother poverty, the demographic groups most similar to Immigrants from Western Africa are Liberian (29.9%, a difference of 0.020%), Jamaican (29.9%, a difference of 0.020%), Immigrants from Ghana (29.9%, a difference of 0.030%), Immigrants from Thailand (29.9%, a difference of 0.050%), and Nicaraguan (29.8%, a difference of 0.10%).
| Demographics | Rating | Rank | Single Mother Poverty |
| Irish | 13.9 /100 | #209 | Poor 29.8% |
| Haitians | 13.3 /100 | #210 | Poor 29.8% |
| Guyanese | 12.8 /100 | #211 | Poor 29.8% |
| Nicaraguans | 12.4 /100 | #212 | Poor 29.8% |
| Immigrants | Thailand | 12.0 /100 | #213 | Poor 29.9% |
| Liberians | 11.7 /100 | #214 | Poor 29.9% |
| Jamaicans | 11.7 /100 | #215 | Poor 29.9% |
| Immigrants | Western Africa | 11.5 /100 | #216 | Poor 29.9% |
| Immigrants | Ghana | 11.3 /100 | #217 | Poor 29.9% |
| Hungarians | 10.3 /100 | #218 | Poor 29.9% |
| Finns | 9.3 /100 | #219 | Tragic 30.0% |
| Germans | 8.8 /100 | #220 | Tragic 30.0% |
| Immigrants | Eritrea | 7.7 /100 | #221 | Tragic 30.0% |
| Sudanese | 7.6 /100 | #222 | Tragic 30.0% |
| Immigrants | Cuba | 6.9 /100 | #223 | Tragic 30.1% |