Chippewa vs Luxembourger Single Mother Poverty
COMPARE
Chippewa
Luxembourger
Single Mother Poverty
Single Mother Poverty Comparison
Chippewa
Luxembourgers
34.8%
SINGLE MOTHER POVERTY
0.0/ 100
METRIC RATING
319th/ 347
METRIC RANK
28.5%
SINGLE MOTHER POVERTY
86.4/ 100
METRIC RATING
144th/ 347
METRIC RANK
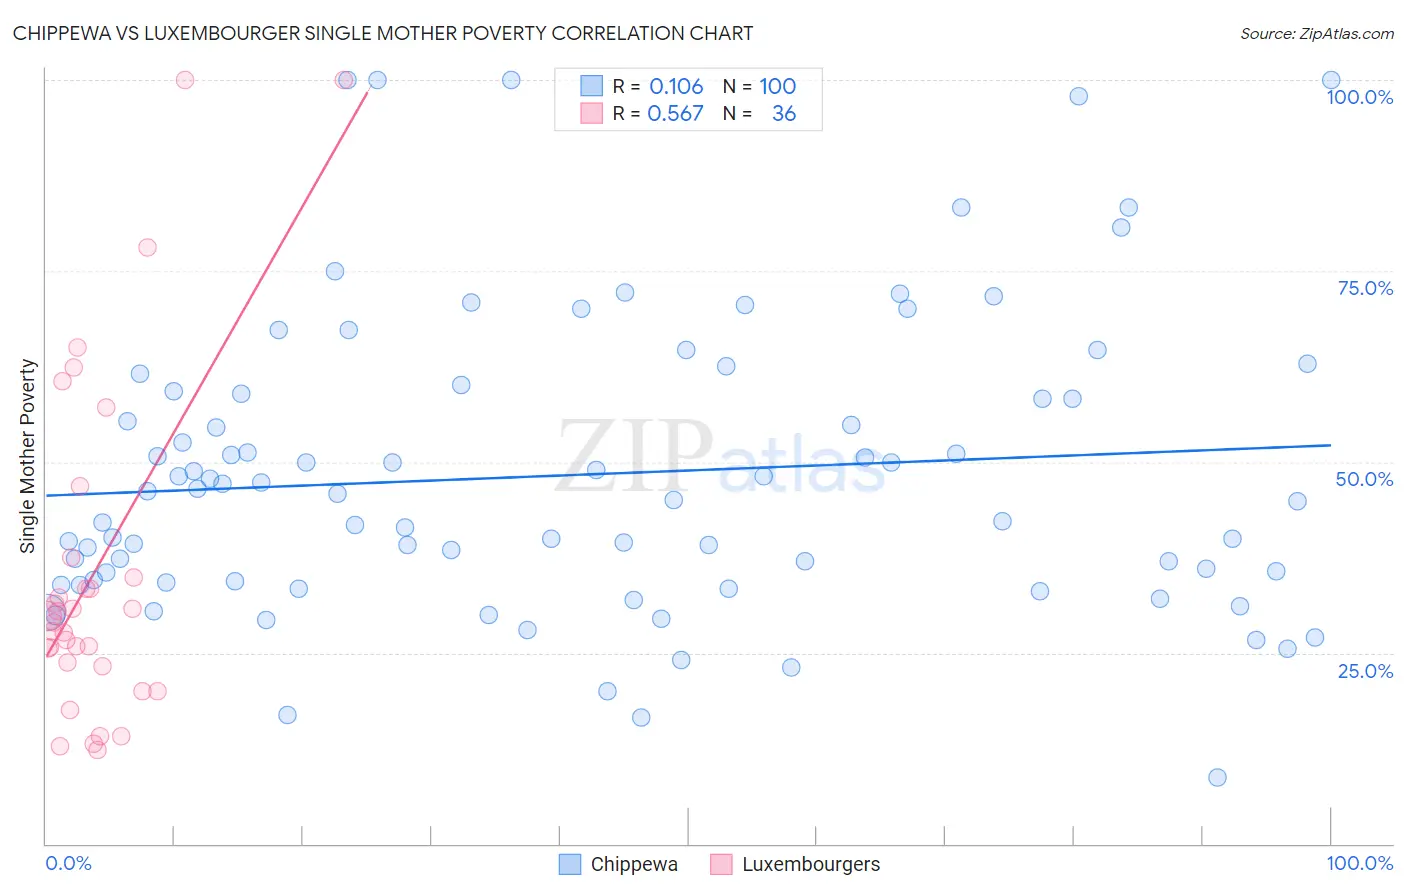
Chippewa vs Luxembourger Single Mother Poverty Correlation Chart
The statistical analysis conducted on geographies consisting of 212,048,110 people shows a poor positive correlation between the proportion of Chippewa and poverty level among single mothers in the United States with a correlation coefficient (R) of 0.106 and weighted average of 34.8%. Similarly, the statistical analysis conducted on geographies consisting of 142,536,891 people shows a substantial positive correlation between the proportion of Luxembourgers and poverty level among single mothers in the United States with a correlation coefficient (R) of 0.567 and weighted average of 28.5%, a difference of 21.9%.
Single Mother Poverty Correlation Summary
| Measurement | Chippewa | Luxembourger |
| Minimum | 8.7% | 12.2% |
| Maximum | 100.0% | 100.0% |
| Range | 91.3% | 87.8% |
| Mean | 48.3% | 35.5% |
| Median | 45.4% | 29.4% |
| Interquartile 25% (IQ1) | 34.3% | 23.5% |
| Interquartile 75% (IQ3) | 59.1% | 36.2% |
| Interquartile Range (IQR) | 24.8% | 12.7% |
| Standard Deviation (Sample) | 19.5% | 22.2% |
| Standard Deviation (Population) | 19.4% | 21.9% |
Similar Demographics by Single Mother Poverty
Demographics Similar to Chippewa by Single Mother Poverty
In terms of single mother poverty, the demographic groups most similar to Chippewa are Immigrants from Honduras (34.7%, a difference of 0.15%), Iroquois (34.8%, a difference of 0.24%), Cherokee (34.5%, a difference of 0.67%), Dominican (34.5%, a difference of 0.78%), and Hopi (34.5%, a difference of 0.90%).
| Demographics | Rating | Rank | Single Mother Poverty |
| Central American Indians | 0.0 /100 | #312 | Tragic 34.3% |
| Immigrants | Dominican Republic | 0.0 /100 | #313 | Tragic 34.4% |
| Chickasaw | 0.0 /100 | #314 | Tragic 34.4% |
| Hopi | 0.0 /100 | #315 | Tragic 34.5% |
| Dominicans | 0.0 /100 | #316 | Tragic 34.5% |
| Cherokee | 0.0 /100 | #317 | Tragic 34.5% |
| Immigrants | Honduras | 0.0 /100 | #318 | Tragic 34.7% |
| Chippewa | 0.0 /100 | #319 | Tragic 34.8% |
| Iroquois | 0.0 /100 | #320 | Tragic 34.8% |
| Paiute | 0.0 /100 | #321 | Tragic 35.1% |
| Blacks/African Americans | 0.0 /100 | #322 | Tragic 35.2% |
| Kiowa | 0.0 /100 | #323 | Tragic 35.5% |
| Ottawa | 0.0 /100 | #324 | Tragic 35.5% |
| Ute | 0.0 /100 | #325 | Tragic 35.7% |
| Seminole | 0.0 /100 | #326 | Tragic 35.8% |
Demographics Similar to Luxembourgers by Single Mother Poverty
In terms of single mother poverty, the demographic groups most similar to Luxembourgers are Immigrants from North America (28.5%, a difference of 0.010%), South African (28.5%, a difference of 0.020%), Immigrants from South America (28.5%, a difference of 0.030%), Immigrants from Denmark (28.5%, a difference of 0.040%), and Danish (28.5%, a difference of 0.070%).
| Demographics | Rating | Rank | Single Mother Poverty |
| Immigrants | Canada | 88.9 /100 | #137 | Excellent 28.4% |
| Immigrants | Belgium | 88.5 /100 | #138 | Excellent 28.5% |
| Samoans | 88.1 /100 | #139 | Excellent 28.5% |
| Immigrants | Colombia | 88.0 /100 | #140 | Excellent 28.5% |
| Danes | 87.1 /100 | #141 | Excellent 28.5% |
| South Africans | 86.6 /100 | #142 | Excellent 28.5% |
| Immigrants | North America | 86.5 /100 | #143 | Excellent 28.5% |
| Luxembourgers | 86.4 /100 | #144 | Excellent 28.5% |
| Immigrants | South America | 86.1 /100 | #145 | Excellent 28.5% |
| Immigrants | Denmark | 86.1 /100 | #146 | Excellent 28.5% |
| Immigrants | Lebanon | 85.3 /100 | #147 | Excellent 28.6% |
| Syrians | 85.3 /100 | #148 | Excellent 28.6% |
| Serbians | 85.0 /100 | #149 | Excellent 28.6% |
| Northern Europeans | 81.7 /100 | #150 | Excellent 28.6% |
| Immigrants | Oceania | 79.9 /100 | #151 | Good 28.7% |