Chippewa vs Arapaho Single Mother Poverty
COMPARE
Chippewa
Arapaho
Single Mother Poverty
Single Mother Poverty Comparison
Chippewa
Arapaho
34.8%
SINGLE MOTHER POVERTY
0.0/ 100
METRIC RATING
319th/ 347
METRIC RANK
33.4%
SINGLE MOTHER POVERTY
0.0/ 100
METRIC RATING
302nd/ 347
METRIC RANK
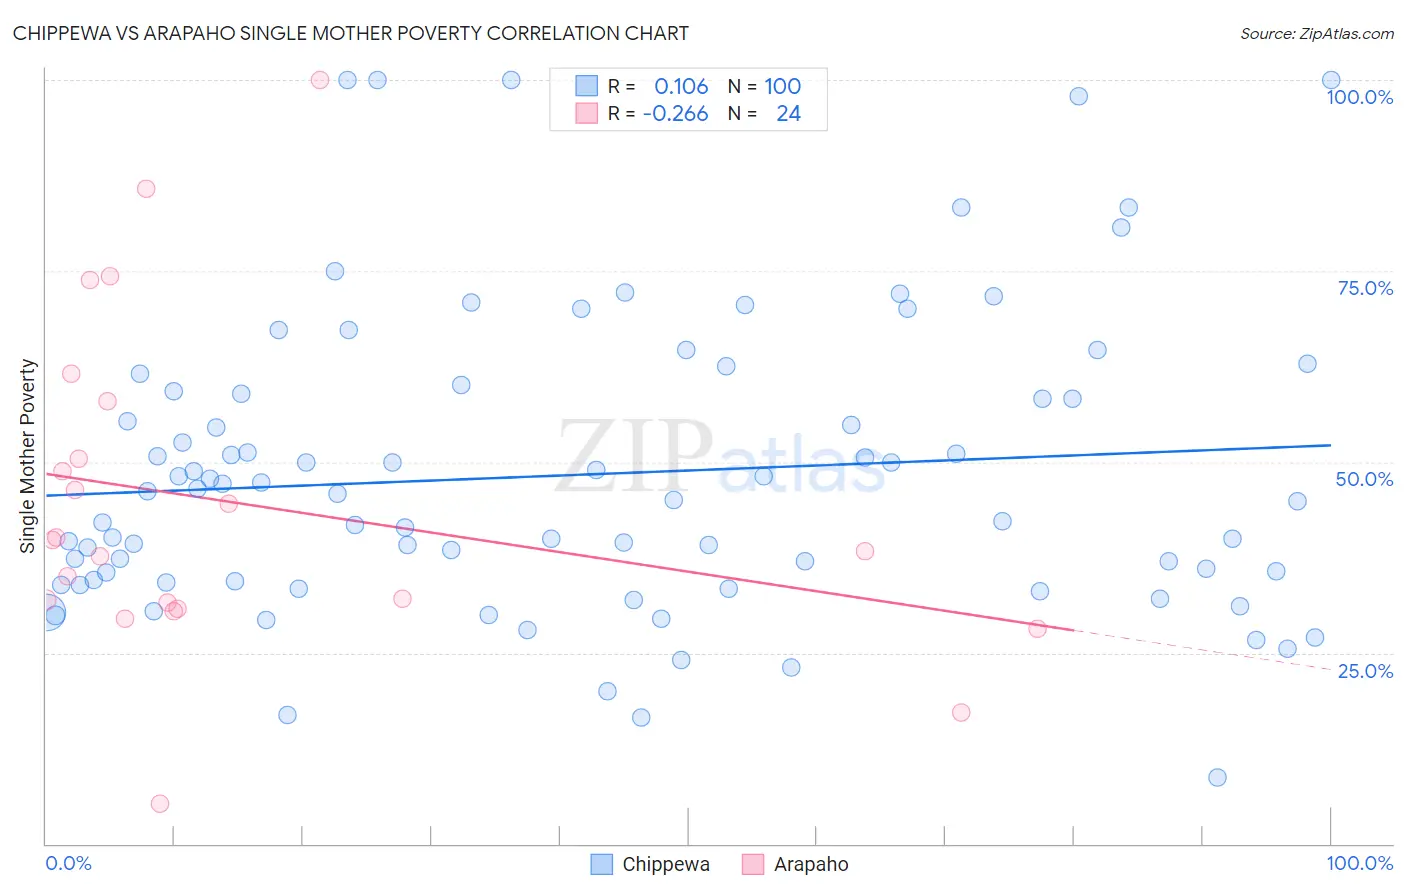
Chippewa vs Arapaho Single Mother Poverty Correlation Chart
The statistical analysis conducted on geographies consisting of 212,048,110 people shows a poor positive correlation between the proportion of Chippewa and poverty level among single mothers in the United States with a correlation coefficient (R) of 0.106 and weighted average of 34.8%. Similarly, the statistical analysis conducted on geographies consisting of 29,572,302 people shows a weak negative correlation between the proportion of Arapaho and poverty level among single mothers in the United States with a correlation coefficient (R) of -0.266 and weighted average of 33.4%, a difference of 4.0%.
Single Mother Poverty Correlation Summary
| Measurement | Chippewa | Arapaho |
| Minimum | 8.7% | 5.3% |
| Maximum | 100.0% | 100.0% |
| Range | 91.3% | 94.7% |
| Mean | 48.3% | 44.6% |
| Median | 45.4% | 39.0% |
| Interquartile 25% (IQ1) | 34.3% | 31.2% |
| Interquartile 75% (IQ3) | 59.1% | 54.1% |
| Interquartile Range (IQR) | 24.8% | 22.9% |
| Standard Deviation (Sample) | 19.5% | 21.8% |
| Standard Deviation (Population) | 19.4% | 21.3% |
Demographics Similar to Chippewa and Arapaho by Single Mother Poverty
In terms of single mother poverty, the demographic groups most similar to Chippewa are Immigrants from Honduras (34.7%, a difference of 0.15%), Iroquois (34.8%, a difference of 0.24%), Cherokee (34.5%, a difference of 0.67%), Dominican (34.5%, a difference of 0.78%), and Hopi (34.5%, a difference of 0.90%). Similarly, the demographic groups most similar to Arapaho are Immigrants from Somalia (33.4%, a difference of 0.15%), American (33.5%, a difference of 0.26%), Mexican (33.6%, a difference of 0.37%), Hispanic or Latino (33.3%, a difference of 0.39%), and Immigrants from Central America (33.6%, a difference of 0.41%).
| Demographics | Rating | Rank | Single Mother Poverty |
| Hispanics or Latinos | 0.0 /100 | #300 | Tragic 33.3% |
| Immigrants | Somalia | 0.0 /100 | #301 | Tragic 33.4% |
| Arapaho | 0.0 /100 | #302 | Tragic 33.4% |
| Americans | 0.0 /100 | #303 | Tragic 33.5% |
| Mexicans | 0.0 /100 | #304 | Tragic 33.6% |
| Immigrants | Central America | 0.0 /100 | #305 | Tragic 33.6% |
| Immigrants | Congo | 0.0 /100 | #306 | Tragic 33.8% |
| Comanche | 0.0 /100 | #307 | Tragic 33.9% |
| Immigrants | Mexico | 0.0 /100 | #308 | Tragic 34.0% |
| Potawatomi | 0.0 /100 | #309 | Tragic 34.1% |
| Hondurans | 0.0 /100 | #310 | Tragic 34.2% |
| Alsatians | 0.0 /100 | #311 | Tragic 34.3% |
| Central American Indians | 0.0 /100 | #312 | Tragic 34.3% |
| Immigrants | Dominican Republic | 0.0 /100 | #313 | Tragic 34.4% |
| Chickasaw | 0.0 /100 | #314 | Tragic 34.4% |
| Hopi | 0.0 /100 | #315 | Tragic 34.5% |
| Dominicans | 0.0 /100 | #316 | Tragic 34.5% |
| Cherokee | 0.0 /100 | #317 | Tragic 34.5% |
| Immigrants | Honduras | 0.0 /100 | #318 | Tragic 34.7% |
| Chippewa | 0.0 /100 | #319 | Tragic 34.8% |
| Iroquois | 0.0 /100 | #320 | Tragic 34.8% |