Chippewa vs Malaysian Single Mother Poverty
COMPARE
Chippewa
Malaysian
Single Mother Poverty
Single Mother Poverty Comparison
Chippewa
Malaysians
34.8%
SINGLE MOTHER POVERTY
0.0/ 100
METRIC RATING
319th/ 347
METRIC RANK
29.7%
SINGLE MOTHER POVERTY
17.4/ 100
METRIC RATING
202nd/ 347
METRIC RANK
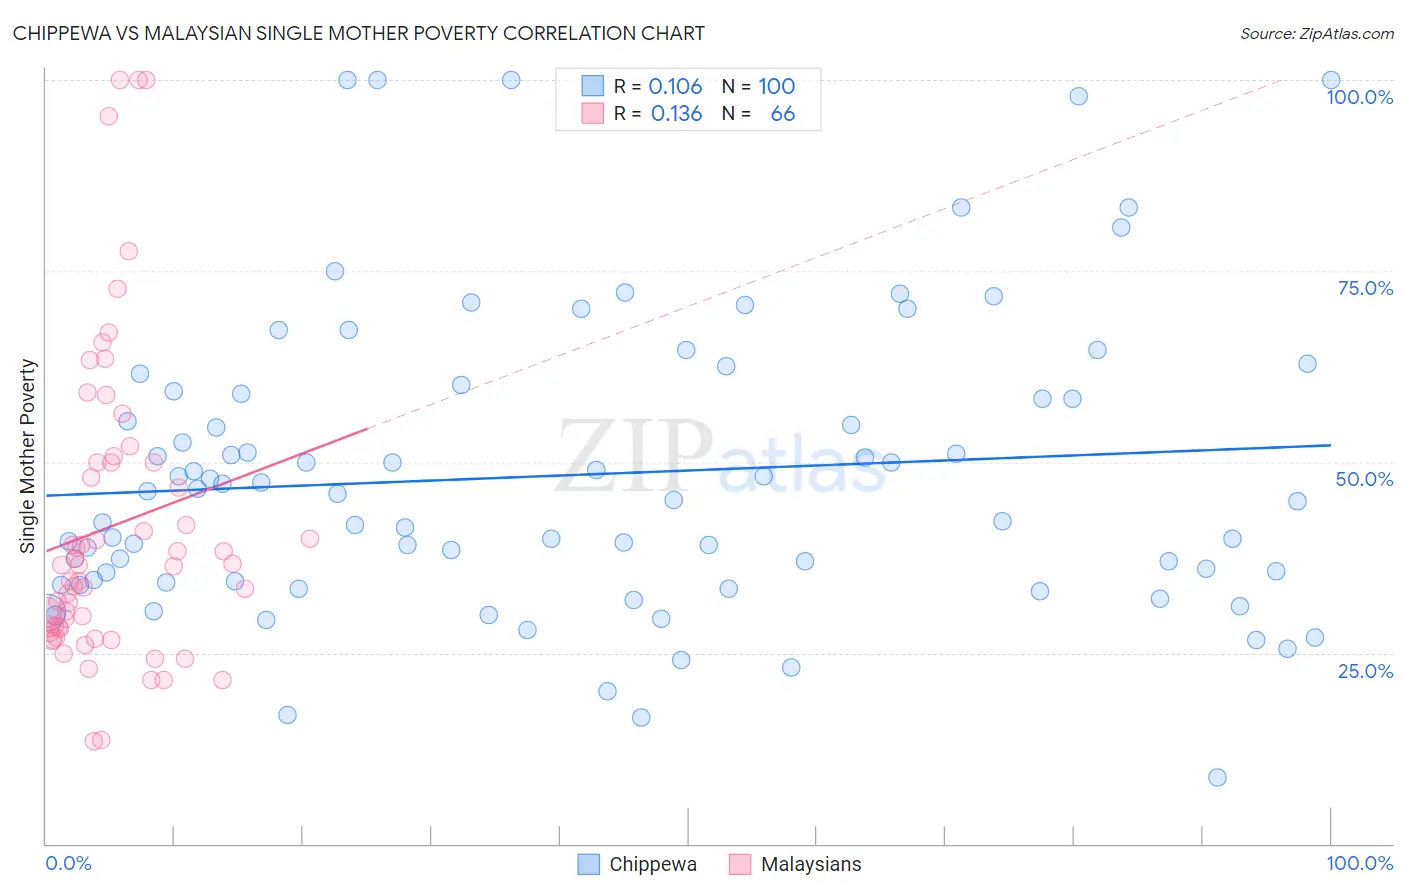
Chippewa vs Malaysian Single Mother Poverty Correlation Chart
The statistical analysis conducted on geographies consisting of 212,048,110 people shows a poor positive correlation between the proportion of Chippewa and poverty level among single mothers in the United States with a correlation coefficient (R) of 0.106 and weighted average of 34.8%. Similarly, the statistical analysis conducted on geographies consisting of 223,567,938 people shows a poor positive correlation between the proportion of Malaysians and poverty level among single mothers in the United States with a correlation coefficient (R) of 0.136 and weighted average of 29.7%, a difference of 17.0%.
Single Mother Poverty Correlation Summary
| Measurement | Chippewa | Malaysian |
| Minimum | 8.7% | 13.4% |
| Maximum | 100.0% | 100.0% |
| Range | 91.3% | 86.6% |
| Mean | 48.3% | 41.5% |
| Median | 45.4% | 36.4% |
| Interquartile 25% (IQ1) | 34.3% | 28.2% |
| Interquartile 75% (IQ3) | 59.1% | 50.0% |
| Interquartile Range (IQR) | 24.8% | 21.8% |
| Standard Deviation (Sample) | 19.5% | 20.1% |
| Standard Deviation (Population) | 19.4% | 20.0% |
Similar Demographics by Single Mother Poverty
Demographics Similar to Chippewa by Single Mother Poverty
In terms of single mother poverty, the demographic groups most similar to Chippewa are Immigrants from Honduras (34.7%, a difference of 0.15%), Iroquois (34.8%, a difference of 0.24%), Cherokee (34.5%, a difference of 0.67%), Dominican (34.5%, a difference of 0.78%), and Hopi (34.5%, a difference of 0.90%).
| Demographics | Rating | Rank | Single Mother Poverty |
| Central American Indians | 0.0 /100 | #312 | Tragic 34.3% |
| Immigrants | Dominican Republic | 0.0 /100 | #313 | Tragic 34.4% |
| Chickasaw | 0.0 /100 | #314 | Tragic 34.4% |
| Hopi | 0.0 /100 | #315 | Tragic 34.5% |
| Dominicans | 0.0 /100 | #316 | Tragic 34.5% |
| Cherokee | 0.0 /100 | #317 | Tragic 34.5% |
| Immigrants | Honduras | 0.0 /100 | #318 | Tragic 34.7% |
| Chippewa | 0.0 /100 | #319 | Tragic 34.8% |
| Iroquois | 0.0 /100 | #320 | Tragic 34.8% |
| Paiute | 0.0 /100 | #321 | Tragic 35.1% |
| Blacks/African Americans | 0.0 /100 | #322 | Tragic 35.2% |
| Kiowa | 0.0 /100 | #323 | Tragic 35.5% |
| Ottawa | 0.0 /100 | #324 | Tragic 35.5% |
| Ute | 0.0 /100 | #325 | Tragic 35.7% |
| Seminole | 0.0 /100 | #326 | Tragic 35.8% |
Demographics Similar to Malaysians by Single Mother Poverty
In terms of single mother poverty, the demographic groups most similar to Malaysians are Swiss (29.7%, a difference of 0.020%), Immigrants (29.7%, a difference of 0.070%), Belgian (29.7%, a difference of 0.10%), Czechoslovakian (29.7%, a difference of 0.11%), and Immigrants from Haiti (29.7%, a difference of 0.14%).
| Demographics | Rating | Rank | Single Mother Poverty |
| Slavs | 24.5 /100 | #195 | Fair 29.6% |
| Spanish American Indians | 23.4 /100 | #196 | Fair 29.6% |
| Immigrants | Jamaica | 22.0 /100 | #197 | Fair 29.6% |
| Trinidadians and Tobagonians | 21.7 /100 | #198 | Fair 29.6% |
| Cubans | 20.8 /100 | #199 | Fair 29.6% |
| Panamanians | 20.0 /100 | #200 | Fair 29.6% |
| Belgians | 18.8 /100 | #201 | Poor 29.7% |
| Malaysians | 17.4 /100 | #202 | Poor 29.7% |
| Swiss | 17.2 /100 | #203 | Poor 29.7% |
| Immigrants | Immigrants | 16.6 /100 | #204 | Poor 29.7% |
| Czechoslovakians | 16.1 /100 | #205 | Poor 29.7% |
| Immigrants | Haiti | 15.8 /100 | #206 | Poor 29.7% |
| Immigrants | Panama | 15.5 /100 | #207 | Poor 29.8% |
| Immigrants | Guyana | 14.7 /100 | #208 | Poor 29.8% |
| Irish | 13.9 /100 | #209 | Poor 29.8% |