Chippewa vs British West Indian Master's Degree
COMPARE
Chippewa
British West Indian
Master's Degree
Master's Degree Comparison
Chippewa
British West Indians
11.4%
MASTER'S DEGREE
0.1/ 100
METRIC RATING
300th/ 347
METRIC RANK
13.8%
MASTER'S DEGREE
8.8/ 100
METRIC RATING
229th/ 347
METRIC RANK
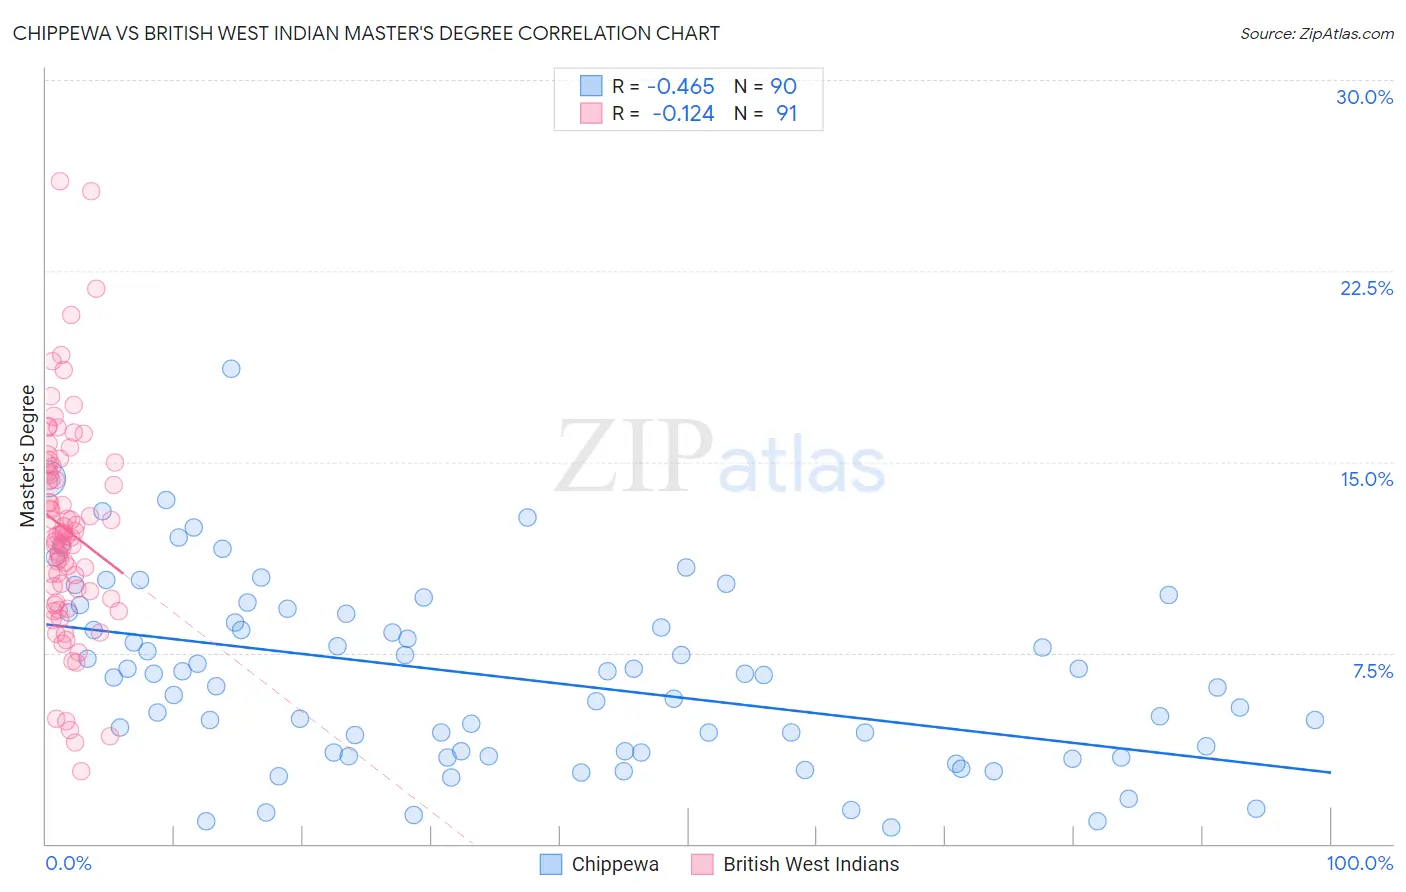
Chippewa vs British West Indian Master's Degree Correlation Chart
The statistical analysis conducted on geographies consisting of 215,015,908 people shows a moderate negative correlation between the proportion of Chippewa and percentage of population with at least master's degree education in the United States with a correlation coefficient (R) of -0.465 and weighted average of 11.4%. Similarly, the statistical analysis conducted on geographies consisting of 152,656,458 people shows a poor negative correlation between the proportion of British West Indians and percentage of population with at least master's degree education in the United States with a correlation coefficient (R) of -0.124 and weighted average of 13.8%, a difference of 20.9%.
Master's Degree Correlation Summary
| Measurement | Chippewa | British West Indian |
| Minimum | 0.64% | 2.9% |
| Maximum | 18.7% | 26.0% |
| Range | 18.0% | 23.1% |
| Mean | 6.5% | 12.3% |
| Median | 6.6% | 12.2% |
| Interquartile 25% (IQ1) | 3.6% | 9.6% |
| Interquartile 75% (IQ3) | 9.0% | 14.8% |
| Interquartile Range (IQR) | 5.4% | 5.2% |
| Standard Deviation (Sample) | 3.6% | 4.2% |
| Standard Deviation (Population) | 3.5% | 4.2% |
Similar Demographics by Master's Degree
Demographics Similar to Chippewa by Master's Degree
In terms of master's degree, the demographic groups most similar to Chippewa are Chickasaw (11.4%, a difference of 0.020%), Tsimshian (11.4%, a difference of 0.16%), Cherokee (11.4%, a difference of 0.47%), Samoan (11.5%, a difference of 0.48%), and Immigrants from Laos (11.4%, a difference of 0.49%).
| Demographics | Rating | Rank | Master's Degree |
| Alaska Natives | 0.1 /100 | #293 | Tragic 11.6% |
| Hawaiians | 0.1 /100 | #294 | Tragic 11.6% |
| Marshallese | 0.1 /100 | #295 | Tragic 11.6% |
| Alaskan Athabascans | 0.1 /100 | #296 | Tragic 11.6% |
| Immigrants | Yemen | 0.1 /100 | #297 | Tragic 11.6% |
| Samoans | 0.1 /100 | #298 | Tragic 11.5% |
| Chickasaw | 0.1 /100 | #299 | Tragic 11.4% |
| Chippewa | 0.1 /100 | #300 | Tragic 11.4% |
| Tsimshian | 0.1 /100 | #301 | Tragic 11.4% |
| Cherokee | 0.1 /100 | #302 | Tragic 11.4% |
| Immigrants | Laos | 0.1 /100 | #303 | Tragic 11.4% |
| Immigrants | Cabo Verde | 0.1 /100 | #304 | Tragic 11.3% |
| Immigrants | Latin America | 0.0 /100 | #305 | Tragic 11.3% |
| Mexican American Indians | 0.0 /100 | #306 | Tragic 11.2% |
| Cheyenne | 0.0 /100 | #307 | Tragic 11.2% |
Demographics Similar to British West Indians by Master's Degree
In terms of master's degree, the demographic groups most similar to British West Indians are Dutch (13.8%, a difference of 0.030%), White/Caucasian (13.8%, a difference of 0.10%), Immigrants from West Indies (13.9%, a difference of 0.42%), Guyanese (13.7%, a difference of 0.58%), and Immigrants from St. Vincent and the Grenadines (13.9%, a difference of 0.86%).
| Demographics | Rating | Rank | Master's Degree |
| Ecuadorians | 12.6 /100 | #222 | Poor 14.0% |
| Immigrants | South Eastern Asia | 11.9 /100 | #223 | Poor 14.0% |
| Immigrants | Grenada | 11.8 /100 | #224 | Poor 14.0% |
| Portuguese | 11.2 /100 | #225 | Poor 13.9% |
| Immigrants | St. Vincent and the Grenadines | 11.0 /100 | #226 | Poor 13.9% |
| Immigrants | West Indies | 9.8 /100 | #227 | Tragic 13.9% |
| Whites/Caucasians | 9.1 /100 | #228 | Tragic 13.8% |
| British West Indians | 8.8 /100 | #229 | Tragic 13.8% |
| Dutch | 8.7 /100 | #230 | Tragic 13.8% |
| Guyanese | 7.6 /100 | #231 | Tragic 13.7% |
| Immigrants | Philippines | 6.0 /100 | #232 | Tragic 13.6% |
| Immigrants | Ecuador | 5.7 /100 | #233 | Tragic 13.6% |
| Immigrants | Burma/Myanmar | 5.0 /100 | #234 | Tragic 13.5% |
| German Russians | 4.5 /100 | #235 | Tragic 13.5% |
| Immigrants | Guyana | 4.4 /100 | #236 | Tragic 13.4% |