Immigrants from Romania vs British West Indian Single Father Poverty
COMPARE
Immigrants from Romania
British West Indian
Single Father Poverty
Single Father Poverty Comparison
Immigrants from Romania
British West Indians
15.5%
SINGLE FATHER POVERTY
98.6/ 100
METRIC RATING
91st/ 347
METRIC RANK
17.7%
SINGLE FATHER POVERTY
0.0/ 100
METRIC RATING
275th/ 347
METRIC RANK
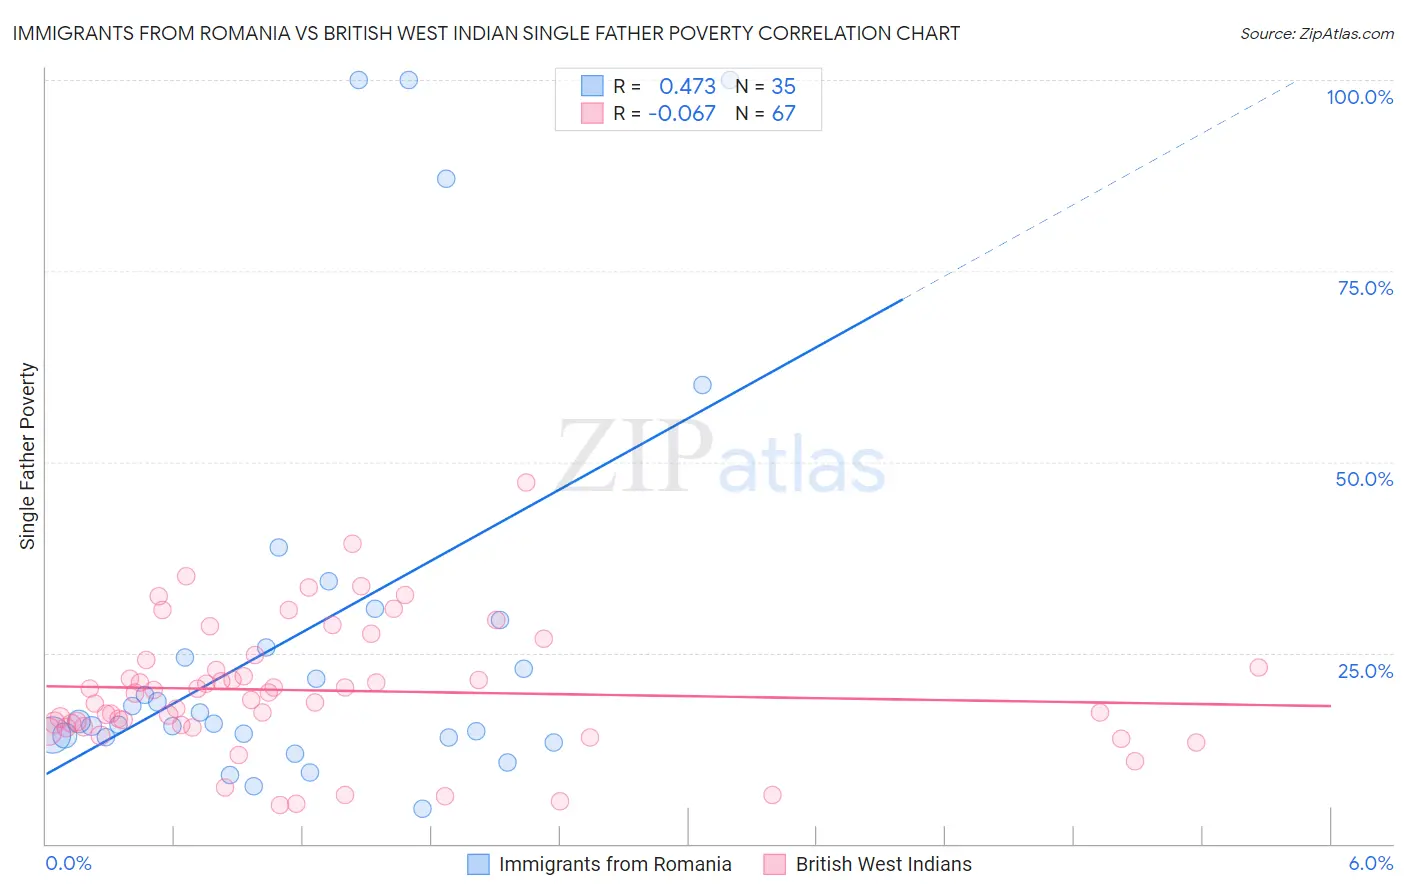
Immigrants from Romania vs British West Indian Single Father Poverty Correlation Chart
The statistical analysis conducted on geographies consisting of 209,903,487 people shows a moderate positive correlation between the proportion of Immigrants from Romania and poverty level among single fathers in the United States with a correlation coefficient (R) of 0.473 and weighted average of 15.5%. Similarly, the statistical analysis conducted on geographies consisting of 135,730,694 people shows a slight negative correlation between the proportion of British West Indians and poverty level among single fathers in the United States with a correlation coefficient (R) of -0.067 and weighted average of 17.7%, a difference of 13.8%.
Single Father Poverty Correlation Summary
| Measurement | Immigrants from Romania | British West Indian |
| Minimum | 4.5% | 5.0% |
| Maximum | 100.0% | 47.4% |
| Range | 95.5% | 42.3% |
| Mean | 27.9% | 20.1% |
| Median | 16.0% | 19.7% |
| Interquartile 25% (IQ1) | 13.9% | 15.3% |
| Interquartile 75% (IQ3) | 29.3% | 24.0% |
| Interquartile Range (IQR) | 15.3% | 8.7% |
| Standard Deviation (Sample) | 27.1% | 8.5% |
| Standard Deviation (Population) | 26.8% | 8.4% |
Similar Demographics by Single Father Poverty
Demographics Similar to Immigrants from Romania by Single Father Poverty
In terms of single father poverty, the demographic groups most similar to Immigrants from Romania are Mexican American Indian (15.5%, a difference of 0.10%), Immigrants from Serbia (15.5%, a difference of 0.11%), Basque (15.5%, a difference of 0.15%), Immigrants from Uruguay (15.6%, a difference of 0.29%), and Immigrants from Korea (15.5%, a difference of 0.34%).
| Demographics | Rating | Rank | Single Father Poverty |
| Peruvians | 99.2 /100 | #84 | Exceptional 15.4% |
| Immigrants | Oceania | 99.1 /100 | #85 | Exceptional 15.4% |
| Immigrants | Russia | 99.0 /100 | #86 | Exceptional 15.5% |
| Brazilians | 99.0 /100 | #87 | Exceptional 15.5% |
| Burmese | 99.0 /100 | #88 | Exceptional 15.5% |
| Immigrants | Korea | 99.0 /100 | #89 | Exceptional 15.5% |
| Mexican American Indians | 98.7 /100 | #90 | Exceptional 15.5% |
| Immigrants | Romania | 98.6 /100 | #91 | Exceptional 15.5% |
| Immigrants | Serbia | 98.5 /100 | #92 | Exceptional 15.5% |
| Basques | 98.4 /100 | #93 | Exceptional 15.5% |
| Immigrants | Uruguay | 98.2 /100 | #94 | Exceptional 15.6% |
| Immigrants | Kazakhstan | 98.2 /100 | #95 | Exceptional 15.6% |
| Immigrants | Belgium | 98.1 /100 | #96 | Exceptional 15.6% |
| Yaqui | 98.1 /100 | #97 | Exceptional 15.6% |
| Zimbabweans | 98.1 /100 | #98 | Exceptional 15.6% |
Demographics Similar to British West Indians by Single Father Poverty
In terms of single father poverty, the demographic groups most similar to British West Indians are German Russian (17.7%, a difference of 0.060%), Macedonian (17.7%, a difference of 0.070%), Lebanese (17.7%, a difference of 0.21%), German (17.7%, a difference of 0.22%), and Iroquois (17.7%, a difference of 0.37%).
| Demographics | Rating | Rank | Single Father Poverty |
| Immigrants | Caribbean | 0.3 /100 | #268 | Tragic 17.4% |
| Slavs | 0.3 /100 | #269 | Tragic 17.4% |
| Indonesians | 0.2 /100 | #270 | Tragic 17.4% |
| French American Indians | 0.2 /100 | #271 | Tragic 17.4% |
| Barbadians | 0.1 /100 | #272 | Tragic 17.5% |
| Italians | 0.1 /100 | #273 | Tragic 17.5% |
| Macedonians | 0.1 /100 | #274 | Tragic 17.7% |
| British West Indians | 0.0 /100 | #275 | Tragic 17.7% |
| German Russians | 0.0 /100 | #276 | Tragic 17.7% |
| Lebanese | 0.0 /100 | #277 | Tragic 17.7% |
| Germans | 0.0 /100 | #278 | Tragic 17.7% |
| Iroquois | 0.0 /100 | #279 | Tragic 17.7% |
| Scottish | 0.0 /100 | #280 | Tragic 17.7% |
| English | 0.0 /100 | #281 | Tragic 17.8% |
| Dutch | 0.0 /100 | #282 | Tragic 17.8% |