Chippewa vs British West Indian Child Poverty Under the Age of 5
COMPARE
Chippewa
British West Indian
Child Poverty Under the Age of 5
Child Poverty Under the Age of 5 Comparison
Chippewa
British West Indians
23.4%
CHILD POVERTY UNDER THE AGE OF 5
0.0/ 100
METRIC RATING
319th/ 347
METRIC RANK
21.4%
CHILD POVERTY UNDER THE AGE OF 5
0.0/ 100
METRIC RATING
291st/ 347
METRIC RANK
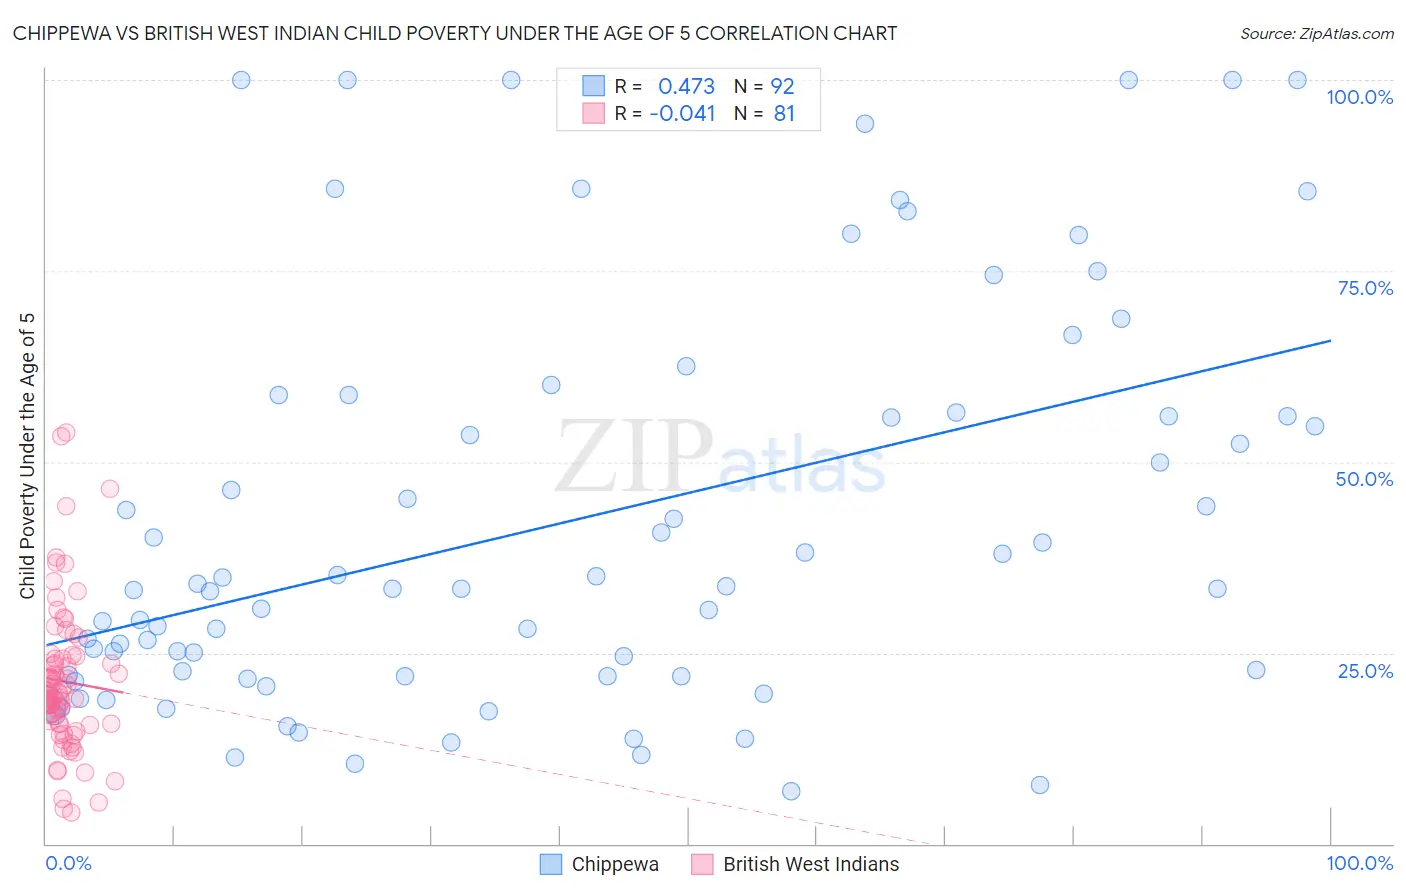
Chippewa vs British West Indian Child Poverty Under the Age of 5 Correlation Chart
The statistical analysis conducted on geographies consisting of 210,183,643 people shows a moderate positive correlation between the proportion of Chippewa and poverty level among children under the age of 5 in the United States with a correlation coefficient (R) of 0.473 and weighted average of 23.4%. Similarly, the statistical analysis conducted on geographies consisting of 150,575,514 people shows no correlation between the proportion of British West Indians and poverty level among children under the age of 5 in the United States with a correlation coefficient (R) of -0.041 and weighted average of 21.4%, a difference of 9.2%.
Child Poverty Under the Age of 5 Correlation Summary
| Measurement | Chippewa | British West Indian |
| Minimum | 6.9% | 4.1% |
| Maximum | 100.0% | 53.9% |
| Range | 93.1% | 49.8% |
| Mean | 42.0% | 21.2% |
| Median | 33.3% | 19.5% |
| Interquartile 25% (IQ1) | 22.0% | 15.7% |
| Interquartile 75% (IQ3) | 56.2% | 24.4% |
| Interquartile Range (IQR) | 34.2% | 8.7% |
| Standard Deviation (Sample) | 26.2% | 9.7% |
| Standard Deviation (Population) | 26.0% | 9.6% |
Similar Demographics by Child Poverty Under the Age of 5
Demographics Similar to Chippewa by Child Poverty Under the Age of 5
In terms of child poverty under the age of 5, the demographic groups most similar to Chippewa are Choctaw (23.5%, a difference of 0.38%), Immigrants from Honduras (23.5%, a difference of 0.41%), Dutch West Indian (23.3%, a difference of 0.48%), Menominee (23.3%, a difference of 0.58%), and Ute (23.5%, a difference of 0.64%).
| Demographics | Rating | Rank | Child Poverty Under the Age of 5 |
| Hondurans | 0.0 /100 | #312 | Tragic 23.0% |
| Bahamians | 0.0 /100 | #313 | Tragic 23.0% |
| U.S. Virgin Islanders | 0.0 /100 | #314 | Tragic 23.0% |
| Arapaho | 0.0 /100 | #315 | Tragic 23.1% |
| Yakama | 0.0 /100 | #316 | Tragic 23.1% |
| Menominee | 0.0 /100 | #317 | Tragic 23.3% |
| Dutch West Indians | 0.0 /100 | #318 | Tragic 23.3% |
| Chippewa | 0.0 /100 | #319 | Tragic 23.4% |
| Choctaw | 0.0 /100 | #320 | Tragic 23.5% |
| Immigrants | Honduras | 0.0 /100 | #321 | Tragic 23.5% |
| Ute | 0.0 /100 | #322 | Tragic 23.5% |
| Pueblo | 0.0 /100 | #323 | Tragic 23.7% |
| Paiute | 0.0 /100 | #324 | Tragic 23.8% |
| Immigrants | Congo | 0.0 /100 | #325 | Tragic 23.9% |
| Central American Indians | 0.0 /100 | #326 | Tragic 23.9% |
Demographics Similar to British West Indians by Child Poverty Under the Age of 5
In terms of child poverty under the age of 5, the demographic groups most similar to British West Indians are Immigrants from Caribbean (21.4%, a difference of 0.17%), Immigrants from Haiti (21.3%, a difference of 0.58%), Immigrants from Somalia (21.6%, a difference of 0.60%), Immigrants from Senegal (21.3%, a difference of 0.65%), and Immigrants from Zaire (21.3%, a difference of 0.82%).
| Demographics | Rating | Rank | Child Poverty Under the Age of 5 |
| Somalis | 0.0 /100 | #284 | Tragic 21.1% |
| Haitians | 0.0 /100 | #285 | Tragic 21.2% |
| Immigrants | Latin America | 0.0 /100 | #286 | Tragic 21.2% |
| Immigrants | Zaire | 0.0 /100 | #287 | Tragic 21.3% |
| Immigrants | Senegal | 0.0 /100 | #288 | Tragic 21.3% |
| Immigrants | Haiti | 0.0 /100 | #289 | Tragic 21.3% |
| Immigrants | Caribbean | 0.0 /100 | #290 | Tragic 21.4% |
| British West Indians | 0.0 /100 | #291 | Tragic 21.4% |
| Immigrants | Somalia | 0.0 /100 | #292 | Tragic 21.6% |
| Mexicans | 0.0 /100 | #293 | Tragic 21.6% |
| Guatemalans | 0.0 /100 | #294 | Tragic 21.6% |
| Cherokee | 0.0 /100 | #295 | Tragic 21.7% |
| Yaqui | 0.0 /100 | #296 | Tragic 21.7% |
| Hispanics or Latinos | 0.0 /100 | #297 | Tragic 21.7% |
| Blackfeet | 0.0 /100 | #298 | Tragic 21.8% |