Chippewa vs Apache Female Poverty Among 25-34 Year Olds
COMPARE
Chippewa
Apache
Female Poverty Among 25-34 Year Olds
Female Poverty Among 25-34 Year Olds Comparison
Chippewa
Apache
18.0%
FEMALE POVERTY AMONG 25-34 YEAR OLDS
0.0/ 100
METRIC RATING
320th/ 347
METRIC RANK
20.1%
FEMALE POVERTY AMONG 25-34 YEAR OLDS
0.0/ 100
METRIC RATING
334th/ 347
METRIC RANK
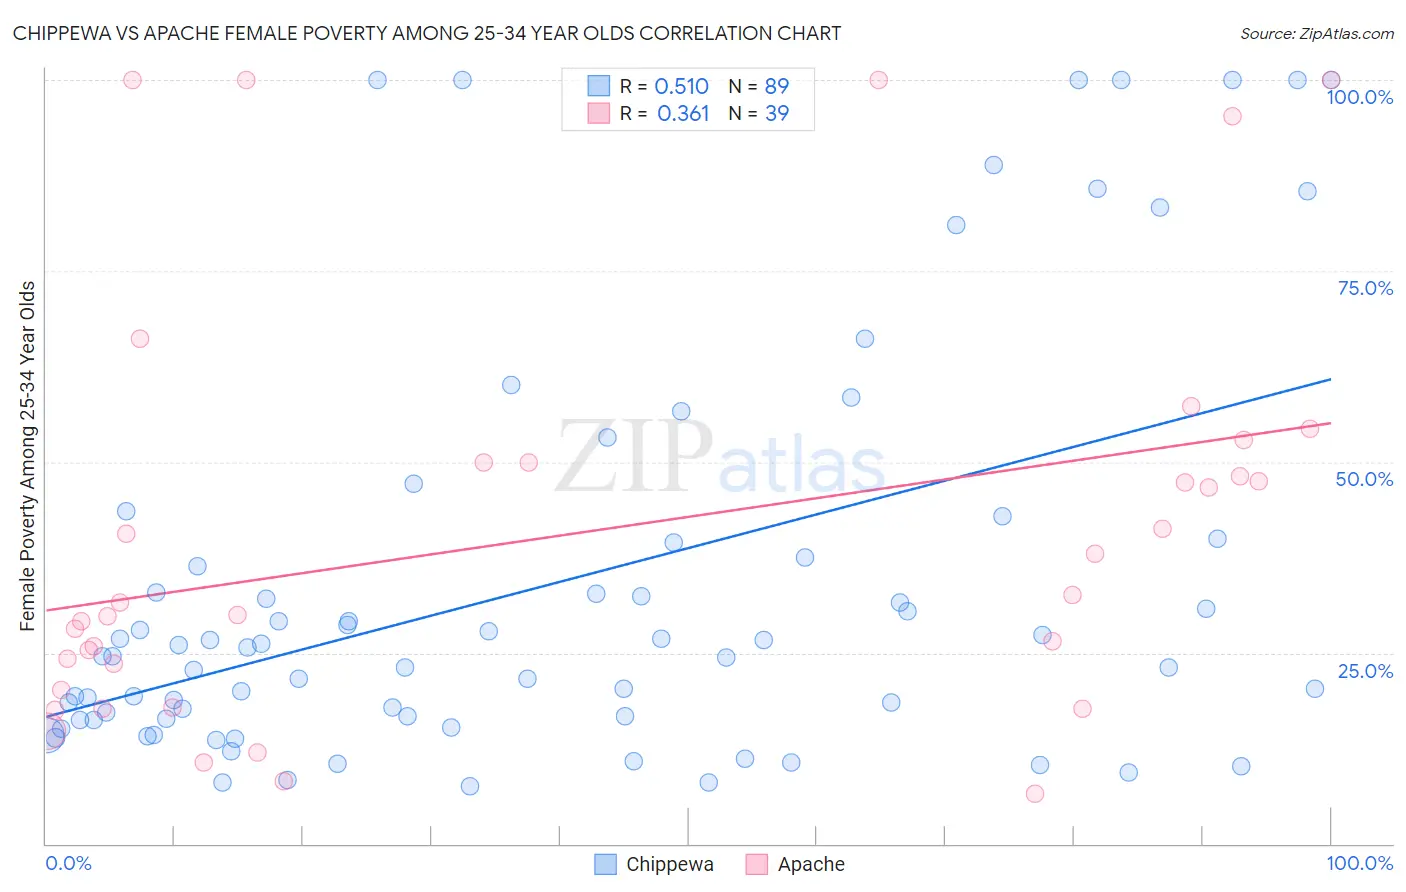
Chippewa vs Apache Female Poverty Among 25-34 Year Olds Correlation Chart
The statistical analysis conducted on geographies consisting of 213,001,722 people shows a substantial positive correlation between the proportion of Chippewa and poverty level among females between the ages 25 and 34 in the United States with a correlation coefficient (R) of 0.510 and weighted average of 18.0%. Similarly, the statistical analysis conducted on geographies consisting of 229,799,768 people shows a mild positive correlation between the proportion of Apache and poverty level among females between the ages 25 and 34 in the United States with a correlation coefficient (R) of 0.361 and weighted average of 20.1%, a difference of 11.4%.
Female Poverty Among 25-34 Year Olds Correlation Summary
| Measurement | Chippewa | Apache |
| Minimum | 7.5% | 6.5% |
| Maximum | 100.0% | 100.0% |
| Range | 92.5% | 93.5% |
| Mean | 33.8% | 40.6% |
| Median | 24.5% | 31.6% |
| Interquartile 25% (IQ1) | 16.3% | 20.2% |
| Interquartile 75% (IQ3) | 38.5% | 50.0% |
| Interquartile Range (IQR) | 22.2% | 29.8% |
| Standard Deviation (Sample) | 26.8% | 27.0% |
| Standard Deviation (Population) | 26.6% | 26.7% |
Demographics Similar to Chippewa and Apache by Female Poverty Among 25-34 Year Olds
In terms of female poverty among 25-34 year olds, the demographic groups most similar to Chippewa are Choctaw (18.1%, a difference of 0.22%), Menominee (18.0%, a difference of 0.26%), Ute (17.9%, a difference of 0.81%), Central American Indian (18.2%, a difference of 1.1%), and Seminole (18.3%, a difference of 1.4%). Similarly, the demographic groups most similar to Apache are Cajun (19.9%, a difference of 0.68%), Native/Alaskan (20.3%, a difference of 1.1%), Immigrants from Yemen (19.8%, a difference of 1.5%), Kiowa (19.7%, a difference of 2.1%), and Paiute (19.6%, a difference of 2.5%).
| Demographics | Rating | Rank | Female Poverty Among 25-34 Year Olds |
| Arapaho | 0.0 /100 | #317 | Tragic 17.8% |
| Ute | 0.0 /100 | #318 | Tragic 17.9% |
| Menominee | 0.0 /100 | #319 | Tragic 18.0% |
| Chippewa | 0.0 /100 | #320 | Tragic 18.0% |
| Choctaw | 0.0 /100 | #321 | Tragic 18.1% |
| Central American Indians | 0.0 /100 | #322 | Tragic 18.2% |
| Seminole | 0.0 /100 | #323 | Tragic 18.3% |
| Dutch West Indians | 0.0 /100 | #324 | Tragic 18.4% |
| Inupiat | 0.0 /100 | #325 | Tragic 18.5% |
| Blacks/African Americans | 0.0 /100 | #326 | Tragic 18.9% |
| Cheyenne | 0.0 /100 | #327 | Tragic 19.1% |
| Alaskan Athabascans | 0.0 /100 | #328 | Tragic 19.1% |
| Creek | 0.0 /100 | #329 | Tragic 19.2% |
| Paiute | 0.0 /100 | #330 | Tragic 19.6% |
| Kiowa | 0.0 /100 | #331 | Tragic 19.7% |
| Immigrants | Yemen | 0.0 /100 | #332 | Tragic 19.8% |
| Cajuns | 0.0 /100 | #333 | Tragic 19.9% |
| Apache | 0.0 /100 | #334 | Tragic 20.1% |
| Natives/Alaskans | 0.0 /100 | #335 | Tragic 20.3% |
| Pueblo | 0.0 /100 | #336 | Tragic 22.2% |
| Crow | 0.0 /100 | #337 | Tragic 22.7% |