Carpatho Rusyn vs Apache Female Poverty Among 25-34 Year Olds
COMPARE
Carpatho Rusyn
Apache
Female Poverty Among 25-34 Year Olds
Female Poverty Among 25-34 Year Olds Comparison
Carpatho Rusyns
Apache
12.8%
FEMALE POVERTY AMONG 25-34 YEAR OLDS
93.0/ 100
METRIC RATING
120th/ 347
METRIC RANK
20.1%
FEMALE POVERTY AMONG 25-34 YEAR OLDS
0.0/ 100
METRIC RATING
334th/ 347
METRIC RANK
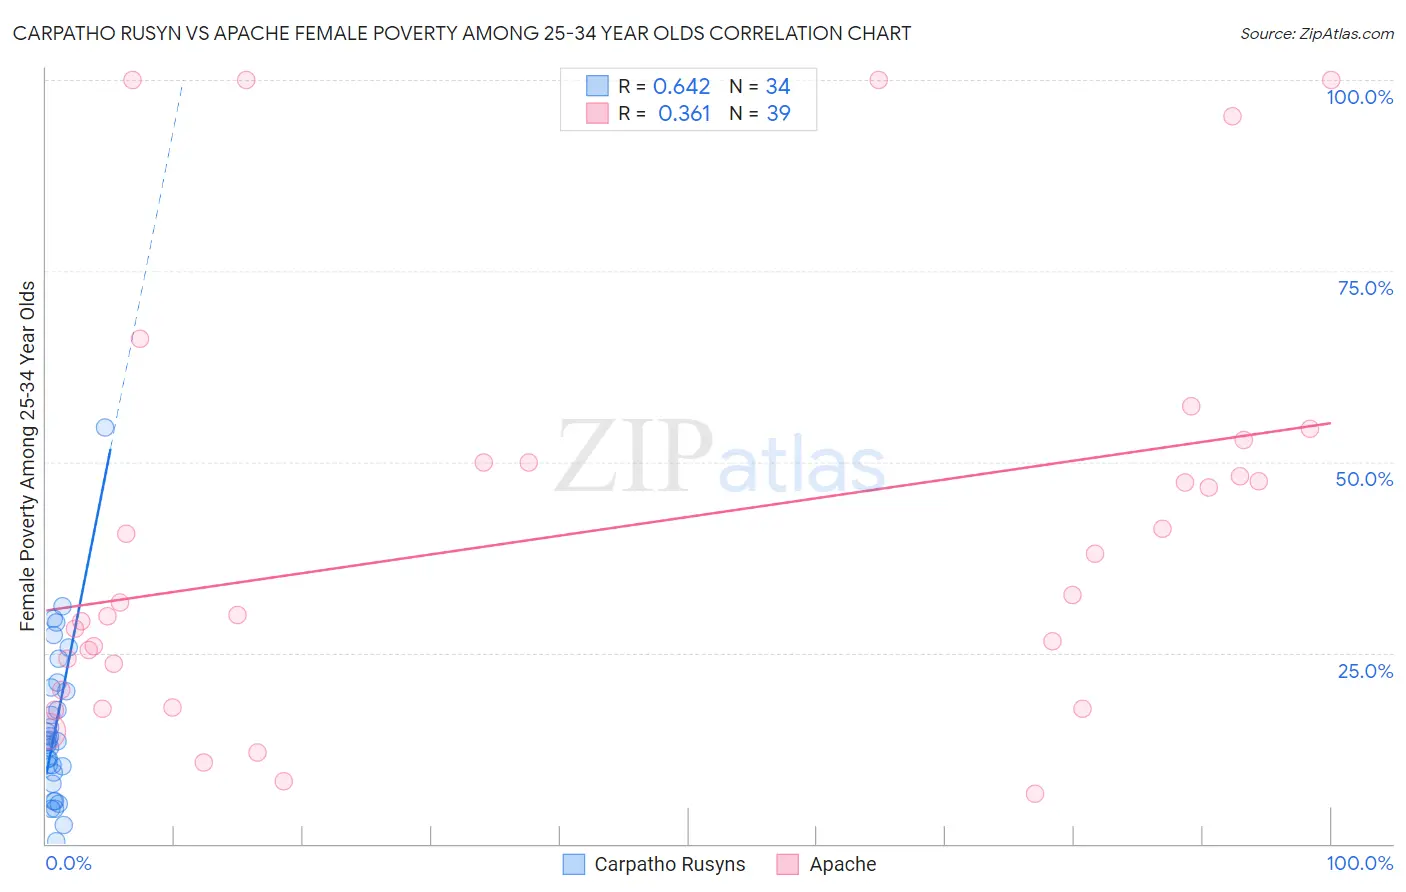
Carpatho Rusyn vs Apache Female Poverty Among 25-34 Year Olds Correlation Chart
The statistical analysis conducted on geographies consisting of 58,469,179 people shows a significant positive correlation between the proportion of Carpatho Rusyns and poverty level among females between the ages 25 and 34 in the United States with a correlation coefficient (R) of 0.642 and weighted average of 12.8%. Similarly, the statistical analysis conducted on geographies consisting of 229,799,768 people shows a mild positive correlation between the proportion of Apache and poverty level among females between the ages 25 and 34 in the United States with a correlation coefficient (R) of 0.361 and weighted average of 20.1%, a difference of 56.8%.
Female Poverty Among 25-34 Year Olds Correlation Summary
| Measurement | Carpatho Rusyn | Apache |
| Minimum | 0.28% | 6.5% |
| Maximum | 54.5% | 100.0% |
| Range | 54.3% | 93.5% |
| Mean | 15.4% | 40.6% |
| Median | 13.4% | 31.6% |
| Interquartile 25% (IQ1) | 9.3% | 20.2% |
| Interquartile 75% (IQ3) | 20.4% | 50.0% |
| Interquartile Range (IQR) | 11.1% | 29.8% |
| Standard Deviation (Sample) | 10.6% | 27.0% |
| Standard Deviation (Population) | 10.5% | 26.7% |
Similar Demographics by Female Poverty Among 25-34 Year Olds
Demographics Similar to Carpatho Rusyns by Female Poverty Among 25-34 Year Olds
In terms of female poverty among 25-34 year olds, the demographic groups most similar to Carpatho Rusyns are Immigrants from Nepal (12.8%, a difference of 0.0%), Mongolian (12.8%, a difference of 0.010%), Immigrants from Kuwait (12.8%, a difference of 0.030%), Romanian (12.8%, a difference of 0.070%), and Immigrants from Western Asia (12.8%, a difference of 0.080%).
| Demographics | Rating | Rank | Female Poverty Among 25-34 Year Olds |
| Immigrants | Syria | 93.8 /100 | #113 | Exceptional 12.8% |
| Immigrants | Southern Europe | 93.6 /100 | #114 | Exceptional 12.8% |
| Immigrants | Brazil | 93.3 /100 | #115 | Exceptional 12.8% |
| Chileans | 93.2 /100 | #116 | Exceptional 12.8% |
| Immigrants | Kuwait | 93.1 /100 | #117 | Exceptional 12.8% |
| Mongolians | 93.0 /100 | #118 | Exceptional 12.8% |
| Immigrants | Nepal | 93.0 /100 | #119 | Exceptional 12.8% |
| Carpatho Rusyns | 93.0 /100 | #120 | Exceptional 12.8% |
| Romanians | 92.8 /100 | #121 | Exceptional 12.8% |
| Immigrants | Western Asia | 92.7 /100 | #122 | Exceptional 12.8% |
| Slovenes | 92.7 /100 | #123 | Exceptional 12.8% |
| Immigrants | Netherlands | 92.0 /100 | #124 | Exceptional 12.8% |
| Immigrants | Canada | 91.5 /100 | #125 | Exceptional 12.9% |
| Immigrants | Fiji | 91.2 /100 | #126 | Exceptional 12.9% |
| Czechs | 90.3 /100 | #127 | Exceptional 12.9% |
Demographics Similar to Apache by Female Poverty Among 25-34 Year Olds
In terms of female poverty among 25-34 year olds, the demographic groups most similar to Apache are Cajun (19.9%, a difference of 0.68%), Native/Alaskan (20.3%, a difference of 1.1%), Immigrants from Yemen (19.8%, a difference of 1.5%), Kiowa (19.7%, a difference of 2.1%), and Paiute (19.6%, a difference of 2.5%).
| Demographics | Rating | Rank | Female Poverty Among 25-34 Year Olds |
| Cheyenne | 0.0 /100 | #327 | Tragic 19.1% |
| Alaskan Athabascans | 0.0 /100 | #328 | Tragic 19.1% |
| Creek | 0.0 /100 | #329 | Tragic 19.2% |
| Paiute | 0.0 /100 | #330 | Tragic 19.6% |
| Kiowa | 0.0 /100 | #331 | Tragic 19.7% |
| Immigrants | Yemen | 0.0 /100 | #332 | Tragic 19.8% |
| Cajuns | 0.0 /100 | #333 | Tragic 19.9% |
| Apache | 0.0 /100 | #334 | Tragic 20.1% |
| Natives/Alaskans | 0.0 /100 | #335 | Tragic 20.3% |
| Pueblo | 0.0 /100 | #336 | Tragic 22.2% |
| Crow | 0.0 /100 | #337 | Tragic 22.7% |
| Houma | 0.0 /100 | #338 | Tragic 22.7% |
| Yuman | 0.0 /100 | #339 | Tragic 22.9% |
| Sioux | 0.0 /100 | #340 | Tragic 23.0% |
| Navajo | 0.0 /100 | #341 | Tragic 23.3% |