Immigrants from Australia vs Apache Female Poverty Among 25-34 Year Olds
COMPARE
Immigrants from Australia
Apache
Female Poverty Among 25-34 Year Olds
Female Poverty Among 25-34 Year Olds Comparison
Immigrants from Australia
Apache
11.9%
FEMALE POVERTY AMONG 25-34 YEAR OLDS
99.7/ 100
METRIC RATING
44th/ 347
METRIC RANK
20.1%
FEMALE POVERTY AMONG 25-34 YEAR OLDS
0.0/ 100
METRIC RATING
334th/ 347
METRIC RANK
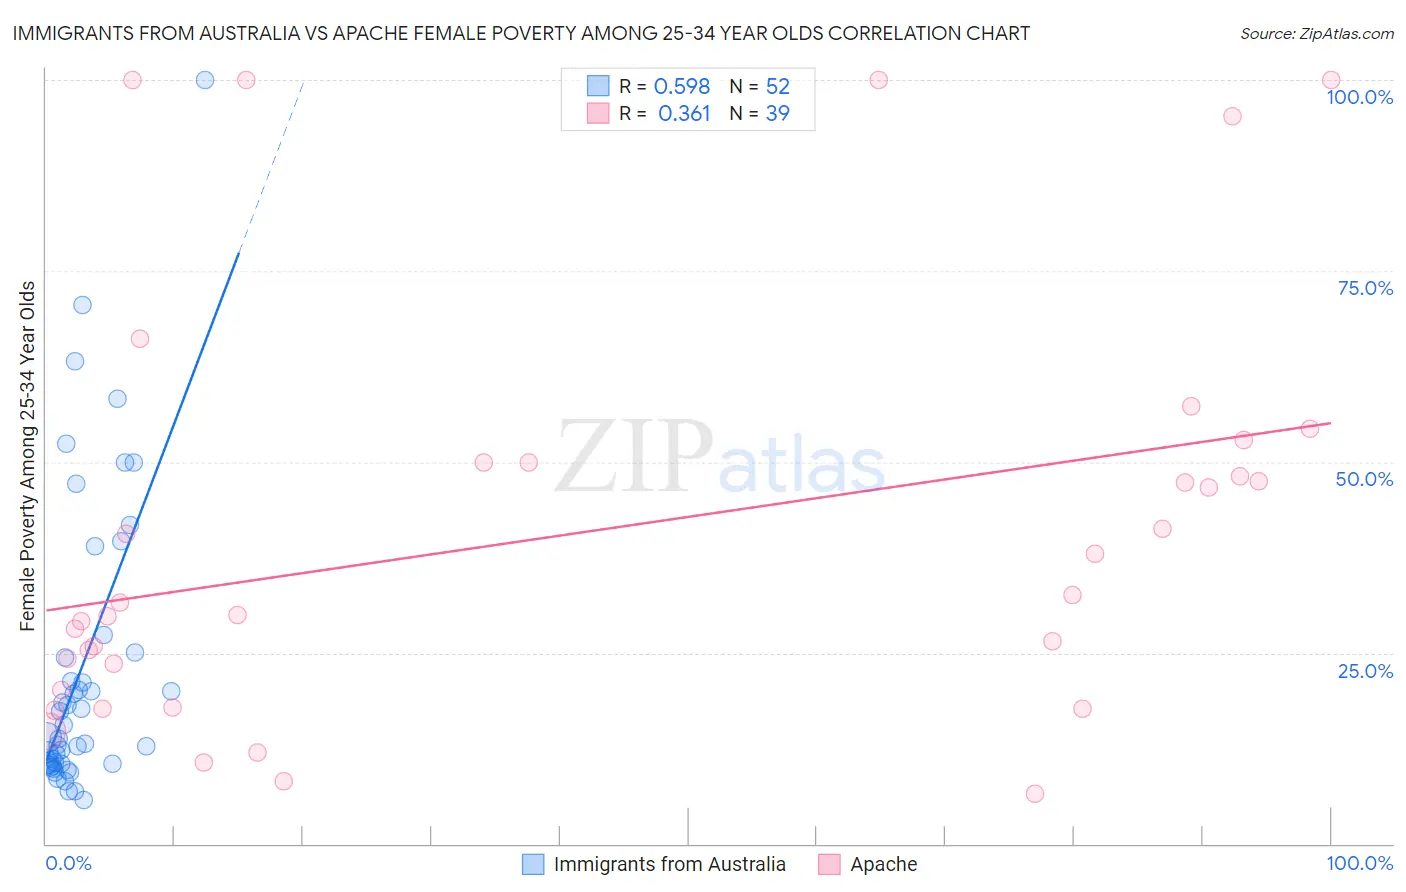
Immigrants from Australia vs Apache Female Poverty Among 25-34 Year Olds Correlation Chart
The statistical analysis conducted on geographies consisting of 224,395,062 people shows a substantial positive correlation between the proportion of Immigrants from Australia and poverty level among females between the ages 25 and 34 in the United States with a correlation coefficient (R) of 0.598 and weighted average of 11.9%. Similarly, the statistical analysis conducted on geographies consisting of 229,799,768 people shows a mild positive correlation between the proportion of Apache and poverty level among females between the ages 25 and 34 in the United States with a correlation coefficient (R) of 0.361 and weighted average of 20.1%, a difference of 68.6%.
Female Poverty Among 25-34 Year Olds Correlation Summary
| Measurement | Immigrants from Australia | Apache |
| Minimum | 5.7% | 6.5% |
| Maximum | 100.0% | 100.0% |
| Range | 94.3% | 93.5% |
| Mean | 22.7% | 40.6% |
| Median | 13.8% | 31.6% |
| Interquartile 25% (IQ1) | 10.4% | 20.2% |
| Interquartile 75% (IQ3) | 24.7% | 50.0% |
| Interquartile Range (IQR) | 14.3% | 29.8% |
| Standard Deviation (Sample) | 19.5% | 27.0% |
| Standard Deviation (Population) | 19.3% | 26.7% |
Similar Demographics by Female Poverty Among 25-34 Year Olds
Demographics Similar to Immigrants from Australia by Female Poverty Among 25-34 Year Olds
In terms of female poverty among 25-34 year olds, the demographic groups most similar to Immigrants from Australia are Egyptian (11.9%, a difference of 0.010%), Immigrants from Turkey (11.9%, a difference of 0.26%), Macedonian (11.9%, a difference of 0.27%), Immigrants from Serbia (11.9%, a difference of 0.27%), and Korean (12.0%, a difference of 0.44%).
| Demographics | Rating | Rank | Female Poverty Among 25-34 Year Olds |
| Taiwanese | 99.8 /100 | #37 | Exceptional 11.8% |
| Immigrants | North Macedonia | 99.8 /100 | #38 | Exceptional 11.8% |
| Latvians | 99.8 /100 | #39 | Exceptional 11.8% |
| Immigrants | Bulgaria | 99.8 /100 | #40 | Exceptional 11.8% |
| Immigrants | Indonesia | 99.8 /100 | #41 | Exceptional 11.8% |
| Immigrants | Turkey | 99.7 /100 | #42 | Exceptional 11.9% |
| Egyptians | 99.7 /100 | #43 | Exceptional 11.9% |
| Immigrants | Australia | 99.7 /100 | #44 | Exceptional 11.9% |
| Macedonians | 99.7 /100 | #45 | Exceptional 11.9% |
| Immigrants | Serbia | 99.7 /100 | #46 | Exceptional 11.9% |
| Koreans | 99.6 /100 | #47 | Exceptional 12.0% |
| Immigrants | Belarus | 99.6 /100 | #48 | Exceptional 12.0% |
| Immigrants | Egypt | 99.6 /100 | #49 | Exceptional 12.0% |
| Immigrants | Croatia | 99.6 /100 | #50 | Exceptional 12.0% |
| Paraguayans | 99.6 /100 | #51 | Exceptional 12.0% |
Demographics Similar to Apache by Female Poverty Among 25-34 Year Olds
In terms of female poverty among 25-34 year olds, the demographic groups most similar to Apache are Cajun (19.9%, a difference of 0.68%), Native/Alaskan (20.3%, a difference of 1.1%), Immigrants from Yemen (19.8%, a difference of 1.5%), Kiowa (19.7%, a difference of 2.1%), and Paiute (19.6%, a difference of 2.5%).
| Demographics | Rating | Rank | Female Poverty Among 25-34 Year Olds |
| Cheyenne | 0.0 /100 | #327 | Tragic 19.1% |
| Alaskan Athabascans | 0.0 /100 | #328 | Tragic 19.1% |
| Creek | 0.0 /100 | #329 | Tragic 19.2% |
| Paiute | 0.0 /100 | #330 | Tragic 19.6% |
| Kiowa | 0.0 /100 | #331 | Tragic 19.7% |
| Immigrants | Yemen | 0.0 /100 | #332 | Tragic 19.8% |
| Cajuns | 0.0 /100 | #333 | Tragic 19.9% |
| Apache | 0.0 /100 | #334 | Tragic 20.1% |
| Natives/Alaskans | 0.0 /100 | #335 | Tragic 20.3% |
| Pueblo | 0.0 /100 | #336 | Tragic 22.2% |
| Crow | 0.0 /100 | #337 | Tragic 22.7% |
| Houma | 0.0 /100 | #338 | Tragic 22.7% |
| Yuman | 0.0 /100 | #339 | Tragic 22.9% |
| Sioux | 0.0 /100 | #340 | Tragic 23.0% |
| Navajo | 0.0 /100 | #341 | Tragic 23.3% |