Chippewa vs Immigrants from Guatemala Female Poverty Among 25-34 Year Olds
COMPARE
Chippewa
Immigrants from Guatemala
Female Poverty Among 25-34 Year Olds
Female Poverty Among 25-34 Year Olds Comparison
Chippewa
Immigrants from Guatemala
18.0%
FEMALE POVERTY AMONG 25-34 YEAR OLDS
0.0/ 100
METRIC RATING
320th/ 347
METRIC RANK
16.6%
FEMALE POVERTY AMONG 25-34 YEAR OLDS
0.0/ 100
METRIC RATING
297th/ 347
METRIC RANK
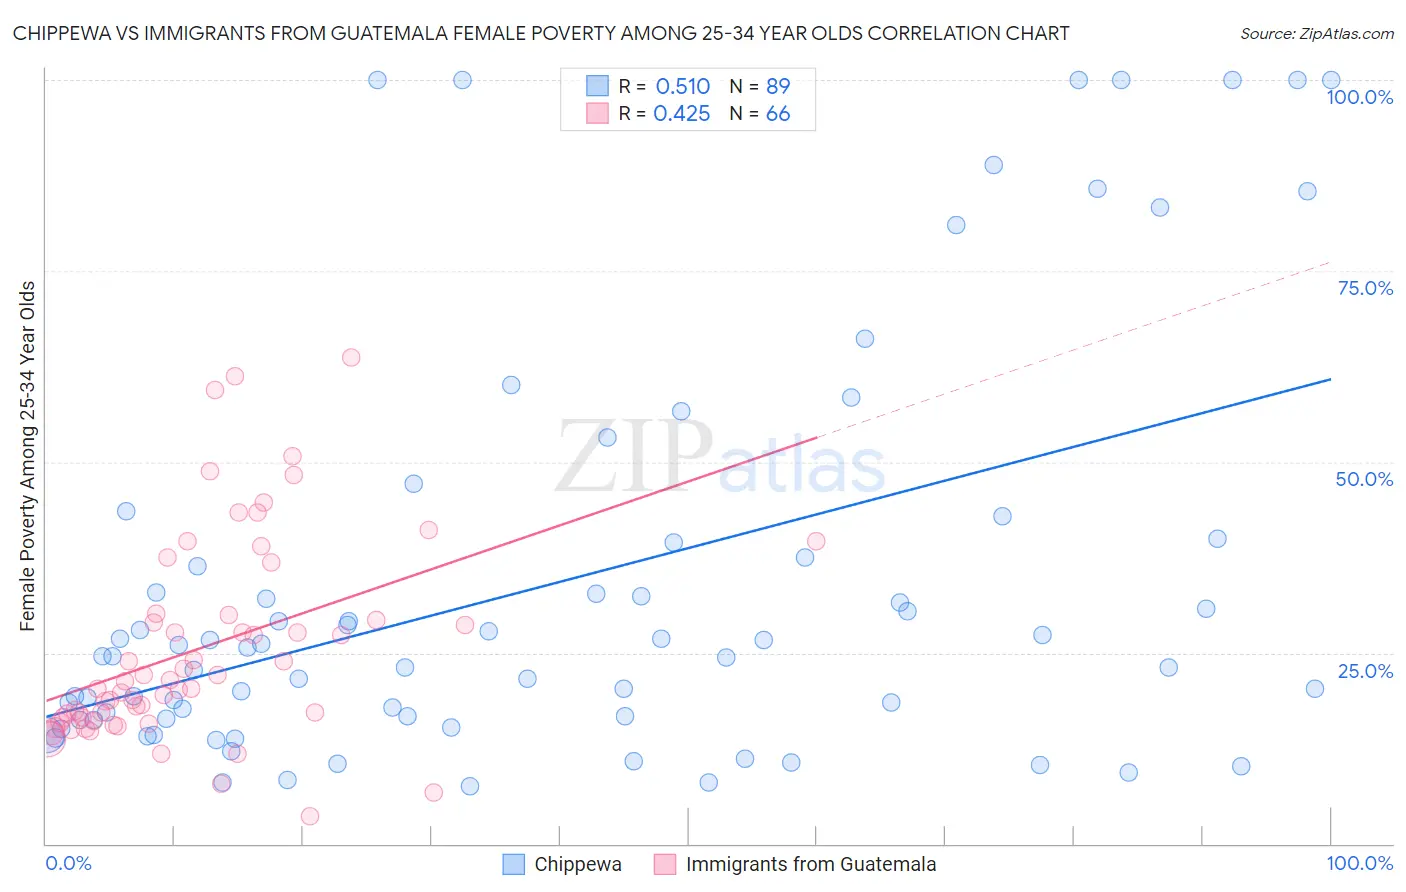
Chippewa vs Immigrants from Guatemala Female Poverty Among 25-34 Year Olds Correlation Chart
The statistical analysis conducted on geographies consisting of 213,001,722 people shows a substantial positive correlation between the proportion of Chippewa and poverty level among females between the ages 25 and 34 in the United States with a correlation coefficient (R) of 0.510 and weighted average of 18.0%. Similarly, the statistical analysis conducted on geographies consisting of 373,350,346 people shows a moderate positive correlation between the proportion of Immigrants from Guatemala and poverty level among females between the ages 25 and 34 in the United States with a correlation coefficient (R) of 0.425 and weighted average of 16.6%, a difference of 8.4%.
Female Poverty Among 25-34 Year Olds Correlation Summary
| Measurement | Chippewa | Immigrants from Guatemala |
| Minimum | 7.5% | 3.7% |
| Maximum | 100.0% | 63.6% |
| Range | 92.5% | 60.0% |
| Mean | 33.8% | 25.5% |
| Median | 24.5% | 20.8% |
| Interquartile 25% (IQ1) | 16.3% | 16.5% |
| Interquartile 75% (IQ3) | 38.5% | 30.0% |
| Interquartile Range (IQR) | 22.2% | 13.5% |
| Standard Deviation (Sample) | 26.8% | 13.3% |
| Standard Deviation (Population) | 26.6% | 13.2% |
Similar Demographics by Female Poverty Among 25-34 Year Olds
Demographics Similar to Chippewa by Female Poverty Among 25-34 Year Olds
In terms of female poverty among 25-34 year olds, the demographic groups most similar to Chippewa are Choctaw (18.1%, a difference of 0.22%), Menominee (18.0%, a difference of 0.26%), Ute (17.9%, a difference of 0.81%), Central American Indian (18.2%, a difference of 1.1%), and Seminole (18.3%, a difference of 1.4%).
| Demographics | Rating | Rank | Female Poverty Among 25-34 Year Olds |
| Colville | 0.0 /100 | #313 | Tragic 17.5% |
| Immigrants | Dominican Republic | 0.0 /100 | #314 | Tragic 17.6% |
| Yakama | 0.0 /100 | #315 | Tragic 17.6% |
| Dominicans | 0.0 /100 | #316 | Tragic 17.6% |
| Arapaho | 0.0 /100 | #317 | Tragic 17.8% |
| Ute | 0.0 /100 | #318 | Tragic 17.9% |
| Menominee | 0.0 /100 | #319 | Tragic 18.0% |
| Chippewa | 0.0 /100 | #320 | Tragic 18.0% |
| Choctaw | 0.0 /100 | #321 | Tragic 18.1% |
| Central American Indians | 0.0 /100 | #322 | Tragic 18.2% |
| Seminole | 0.0 /100 | #323 | Tragic 18.3% |
| Dutch West Indians | 0.0 /100 | #324 | Tragic 18.4% |
| Inupiat | 0.0 /100 | #325 | Tragic 18.5% |
| Blacks/African Americans | 0.0 /100 | #326 | Tragic 18.9% |
| Cheyenne | 0.0 /100 | #327 | Tragic 19.1% |
Demographics Similar to Immigrants from Guatemala by Female Poverty Among 25-34 Year Olds
In terms of female poverty among 25-34 year olds, the demographic groups most similar to Immigrants from Guatemala are Hispanic or Latino (16.6%, a difference of 0.060%), Mexican (16.6%, a difference of 0.26%), Immigrants from Central America (16.6%, a difference of 0.33%), Blackfeet (16.7%, a difference of 0.51%), and Spanish American (16.7%, a difference of 0.55%).
| Demographics | Rating | Rank | Female Poverty Among 25-34 Year Olds |
| Indonesians | 0.0 /100 | #290 | Tragic 16.4% |
| Comanche | 0.0 /100 | #291 | Tragic 16.5% |
| Immigrants | Dominica | 0.0 /100 | #292 | Tragic 16.5% |
| Potawatomi | 0.0 /100 | #293 | Tragic 16.5% |
| Immigrants | Central America | 0.0 /100 | #294 | Tragic 16.6% |
| Mexicans | 0.0 /100 | #295 | Tragic 16.6% |
| Hispanics or Latinos | 0.0 /100 | #296 | Tragic 16.6% |
| Immigrants | Guatemala | 0.0 /100 | #297 | Tragic 16.6% |
| Blackfeet | 0.0 /100 | #298 | Tragic 16.7% |
| Spanish Americans | 0.0 /100 | #299 | Tragic 16.7% |
| U.S. Virgin Islanders | 0.0 /100 | #300 | Tragic 16.7% |
| Immigrants | Congo | 0.0 /100 | #301 | Tragic 16.7% |
| Alaska Natives | 0.0 /100 | #302 | Tragic 16.8% |
| Immigrants | Mexico | 0.0 /100 | #303 | Tragic 16.8% |
| Hondurans | 0.0 /100 | #304 | Tragic 16.9% |